
Overview
This page presents the projected effects of population and demographic trends on demand for homes in the greater Upper Valley region by the year 2030. By understanding how demand for homes will change over the next decade, communities can plan for the needs of current and future residents.
Specific goals for this task included:
· Project year 2030 population, number of households, and average number of persons per household at the county, municipal, and regional planning commission level.
· Create a model that can be easily updated with 2020 Census data.
· Break down results by owner- and renter-occupied units.
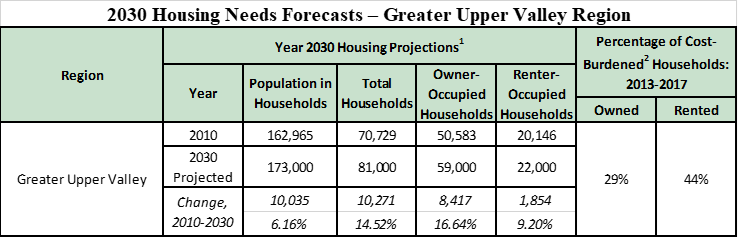
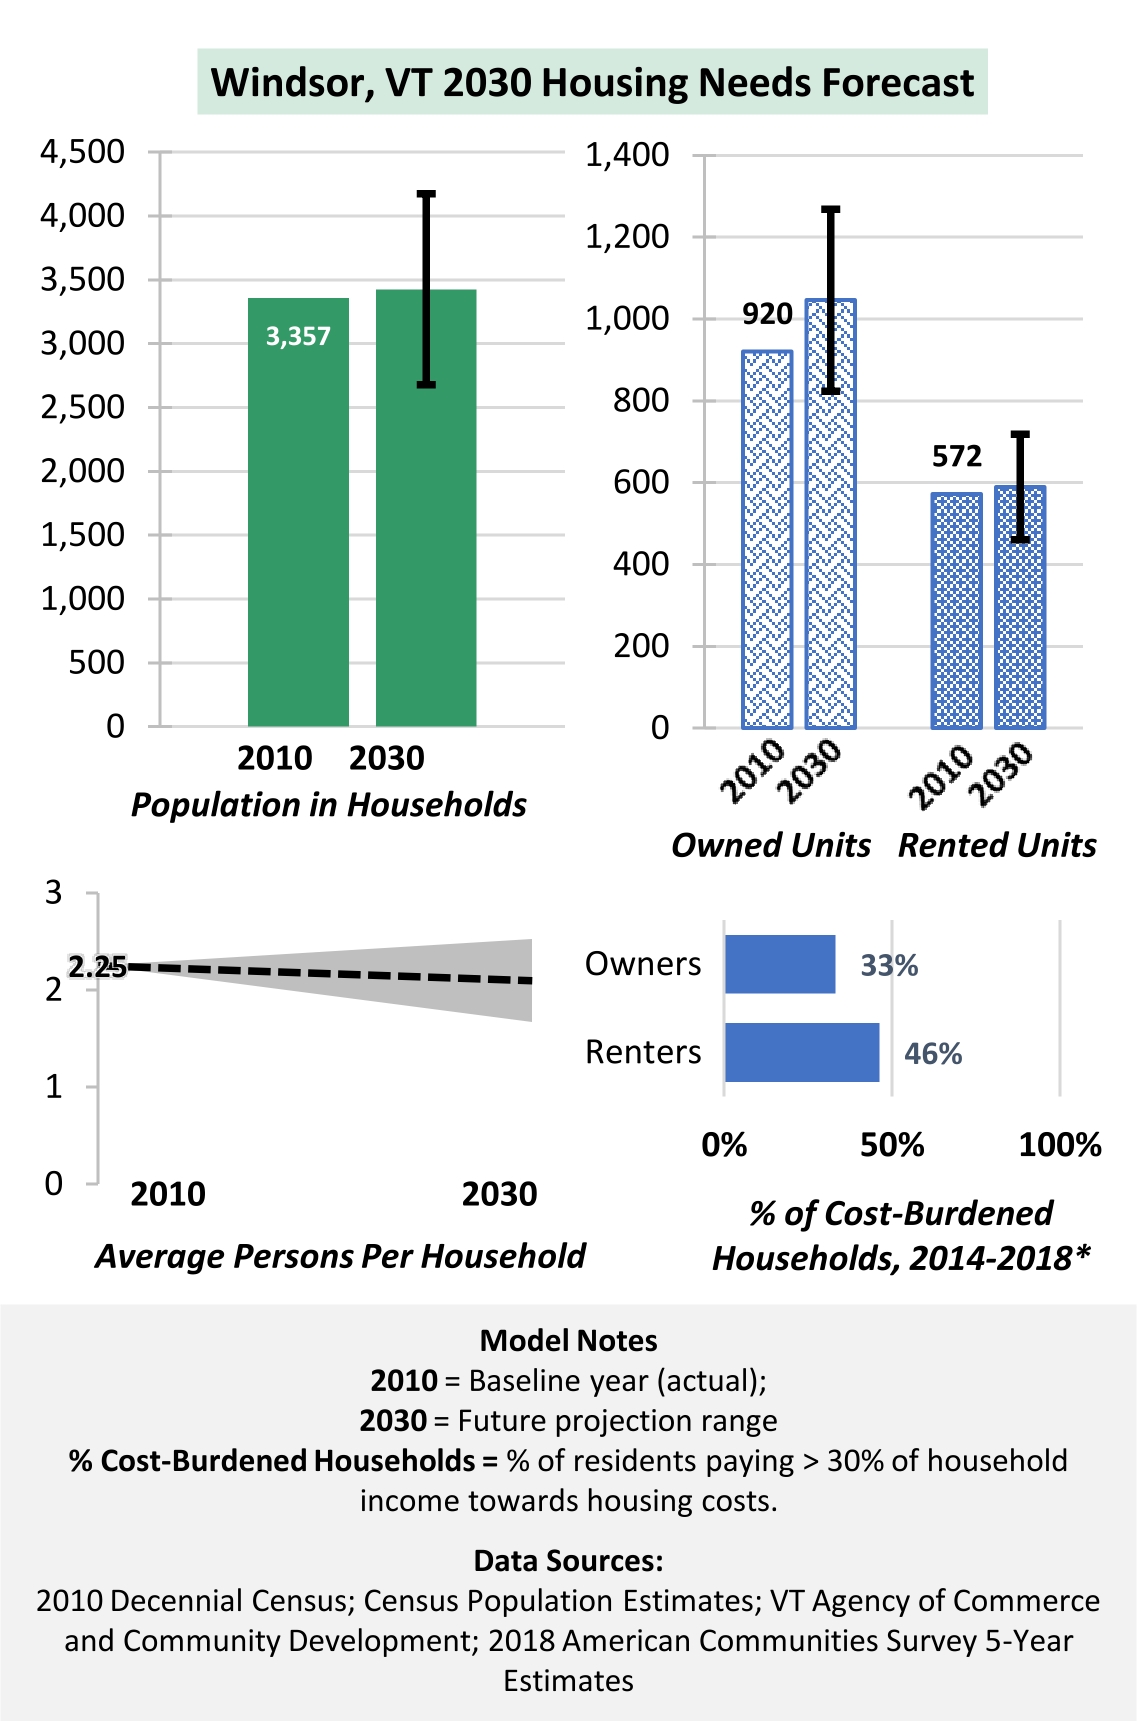
Key Result #2 – There is significant demand for more affordable homes in the region.
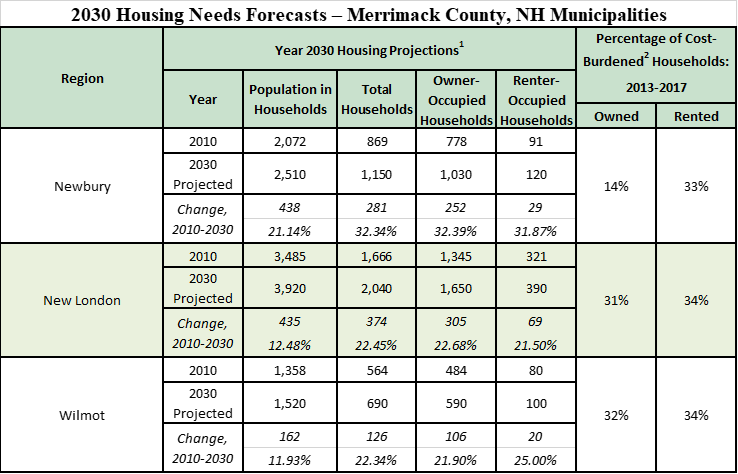
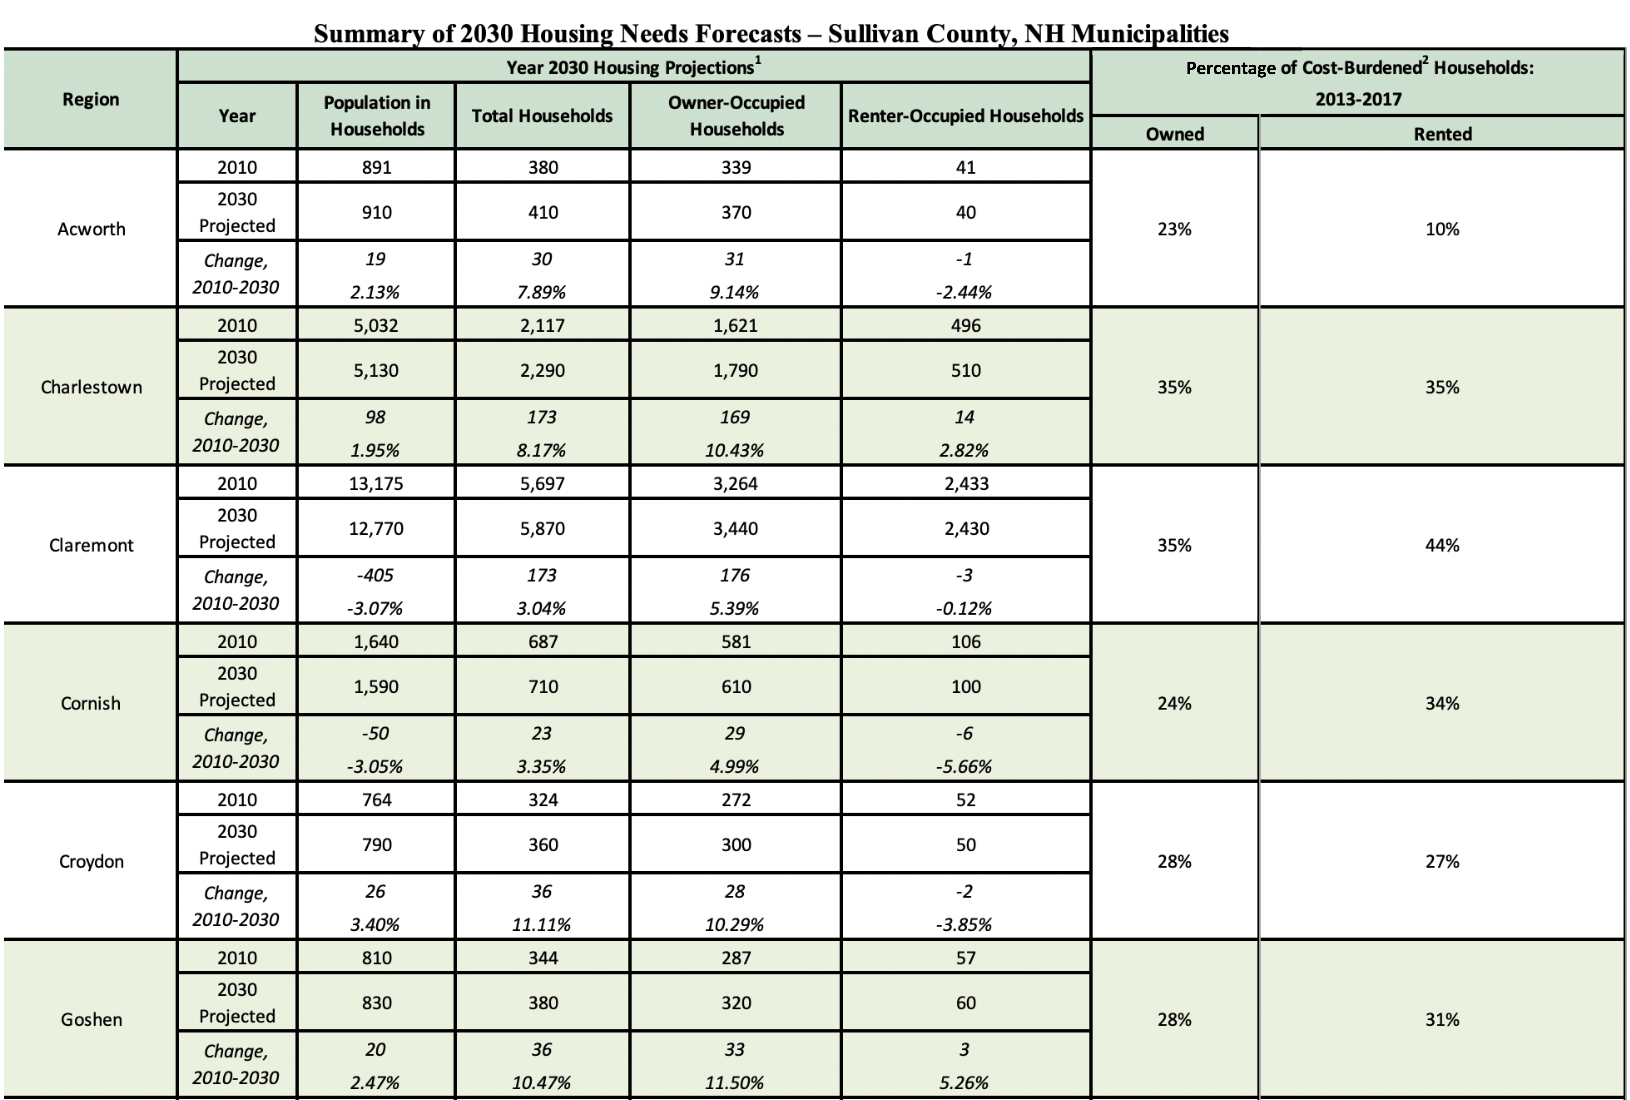
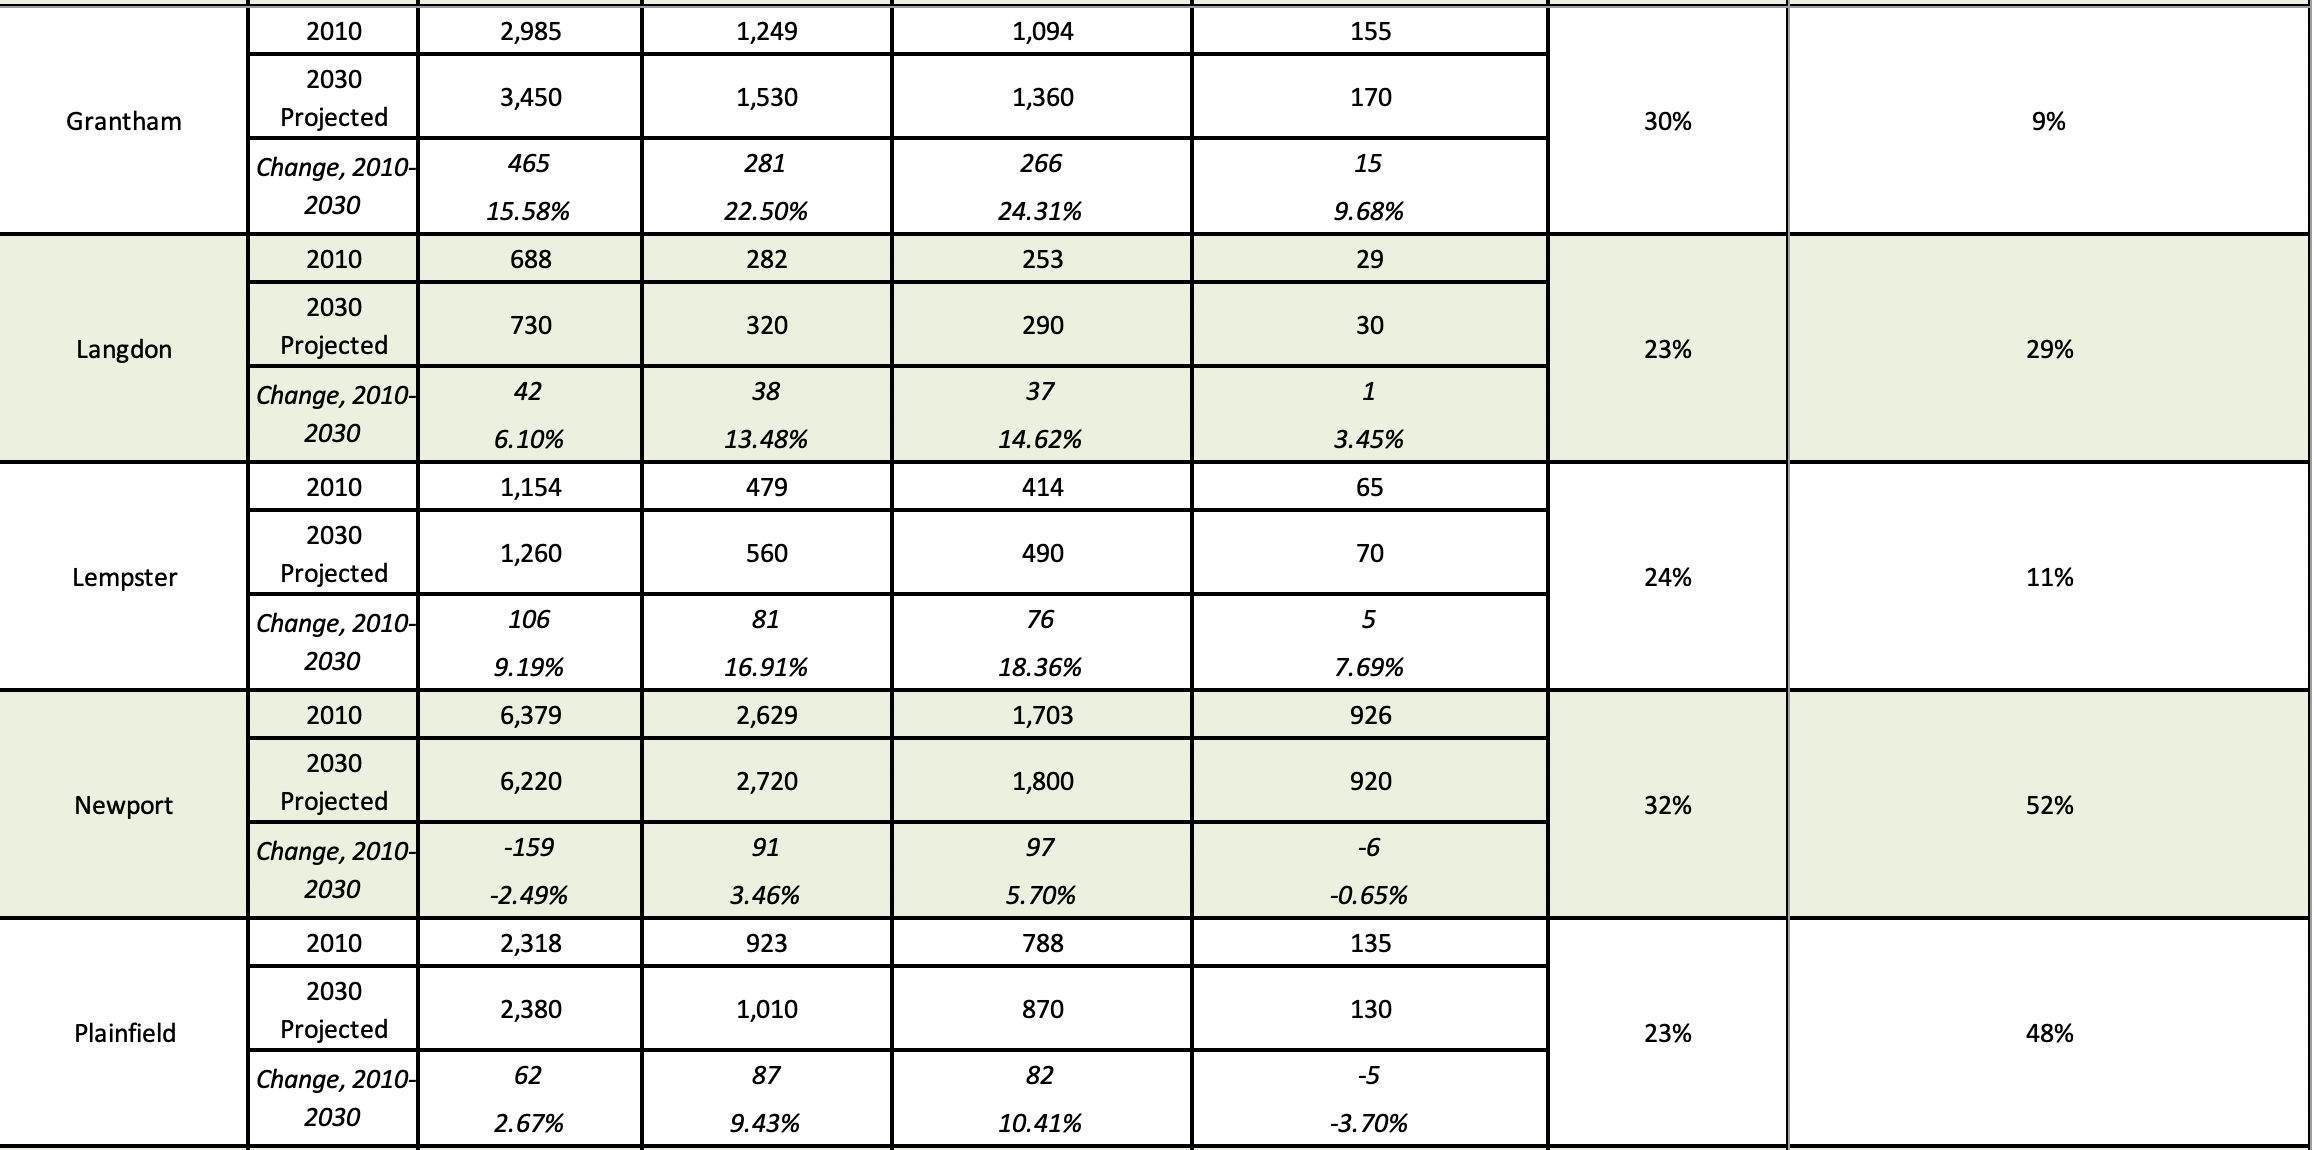
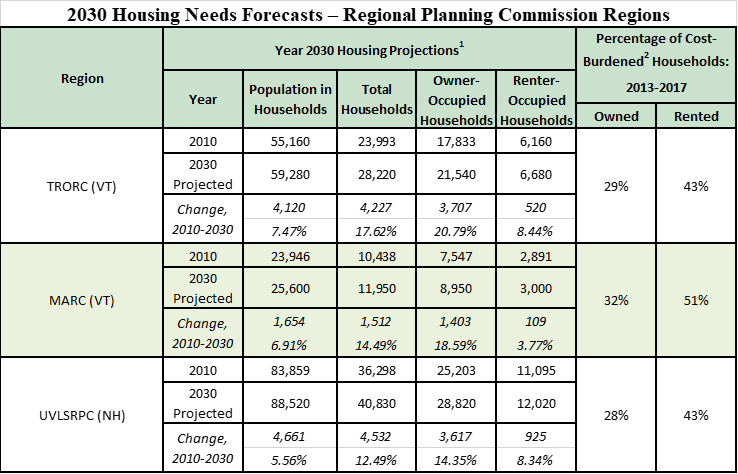
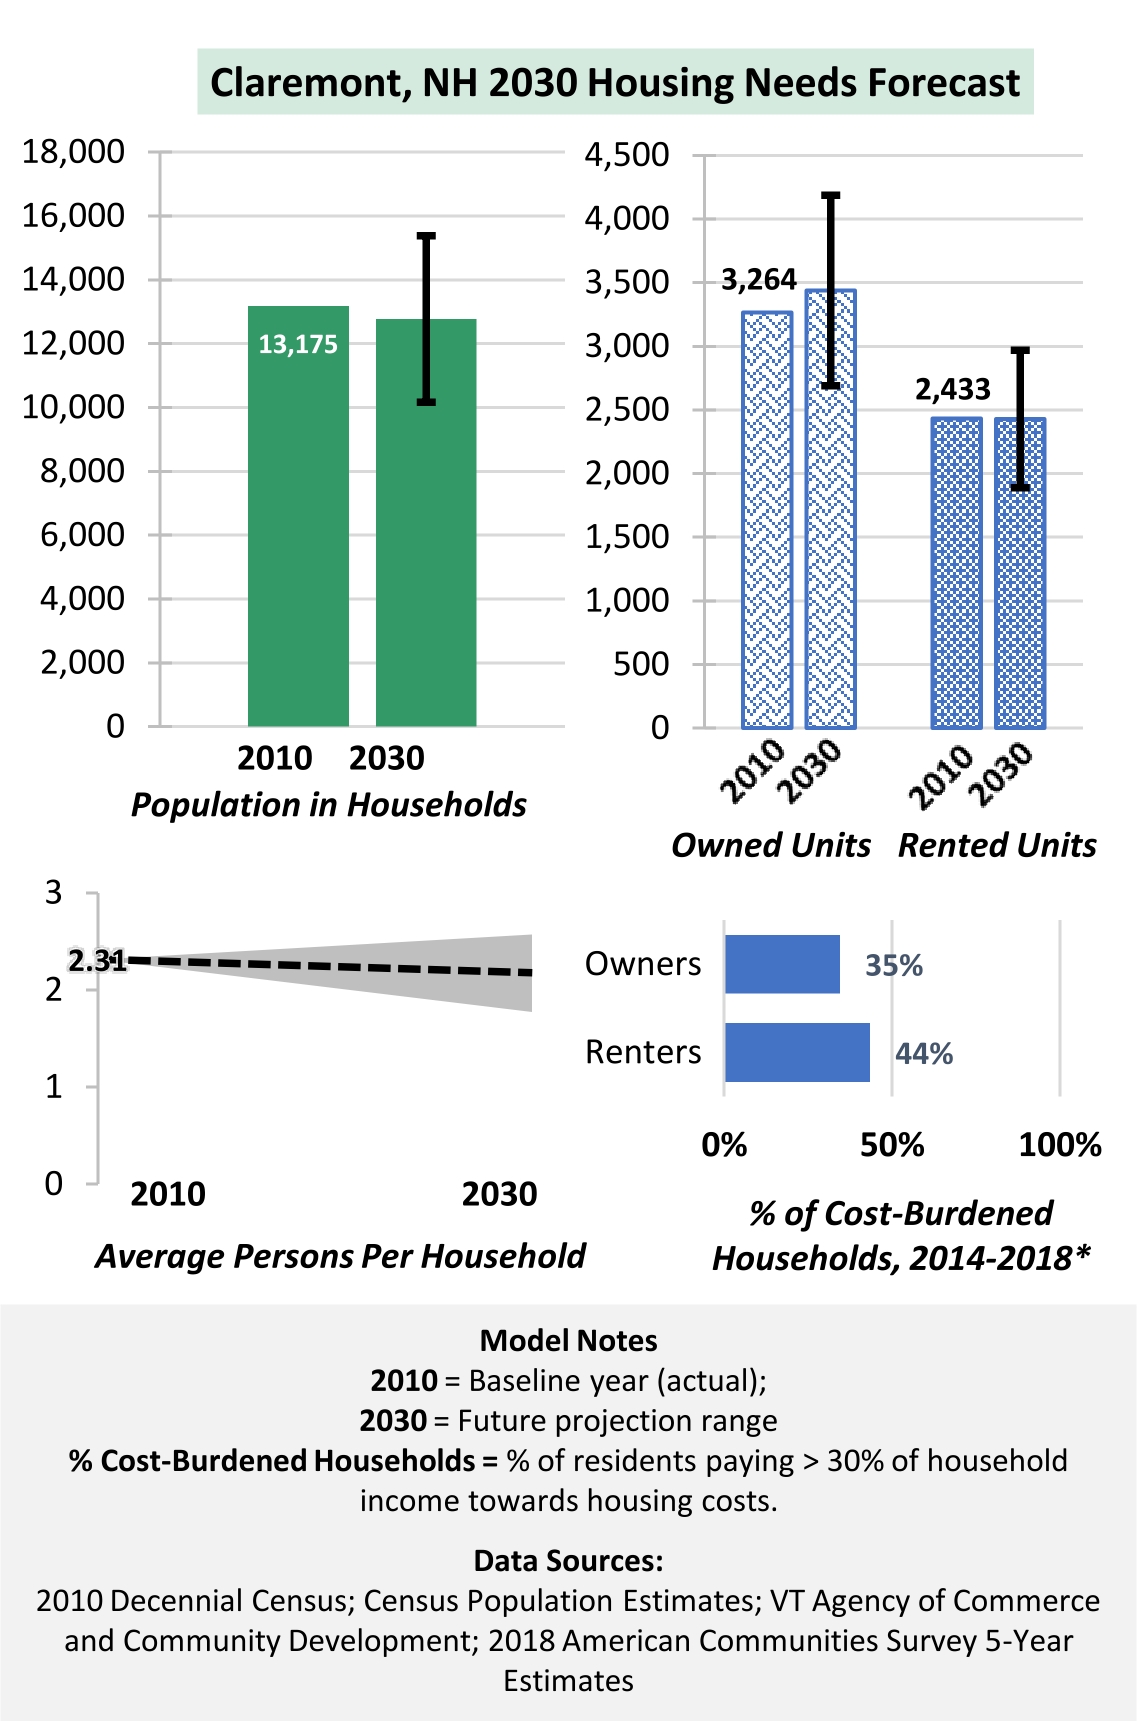
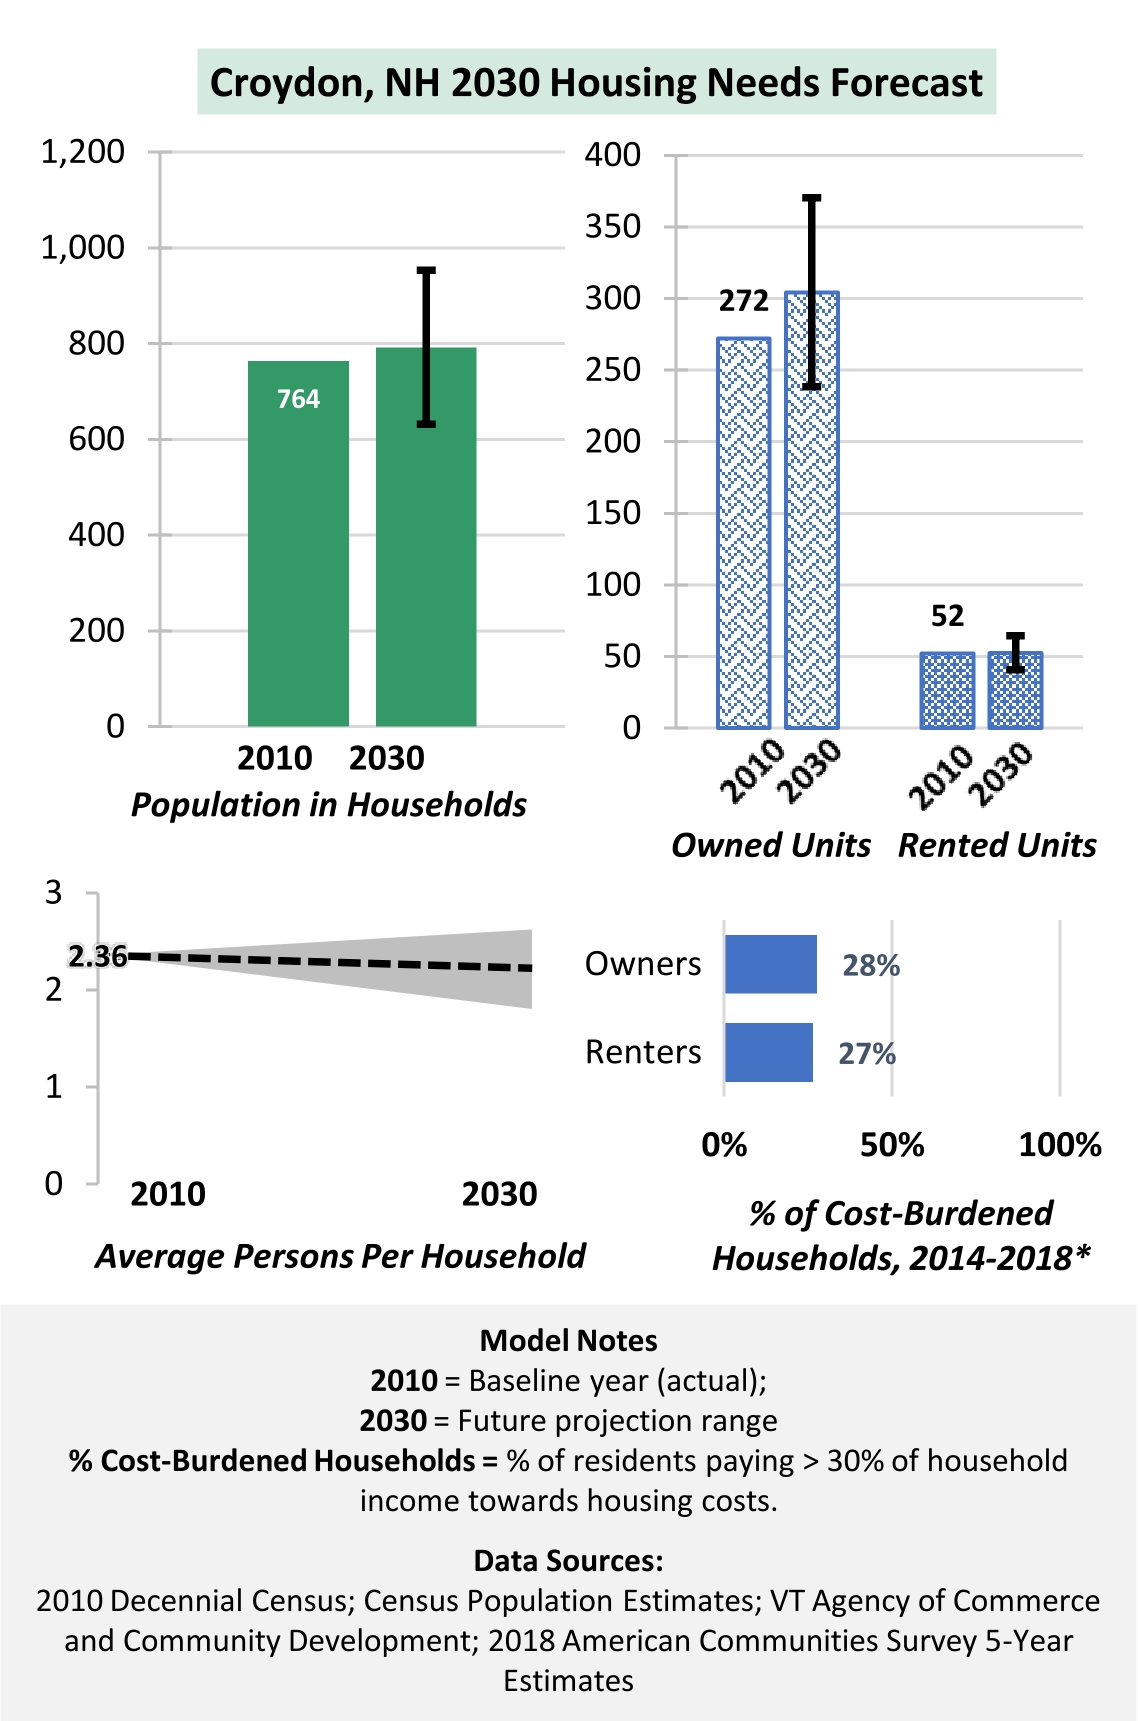
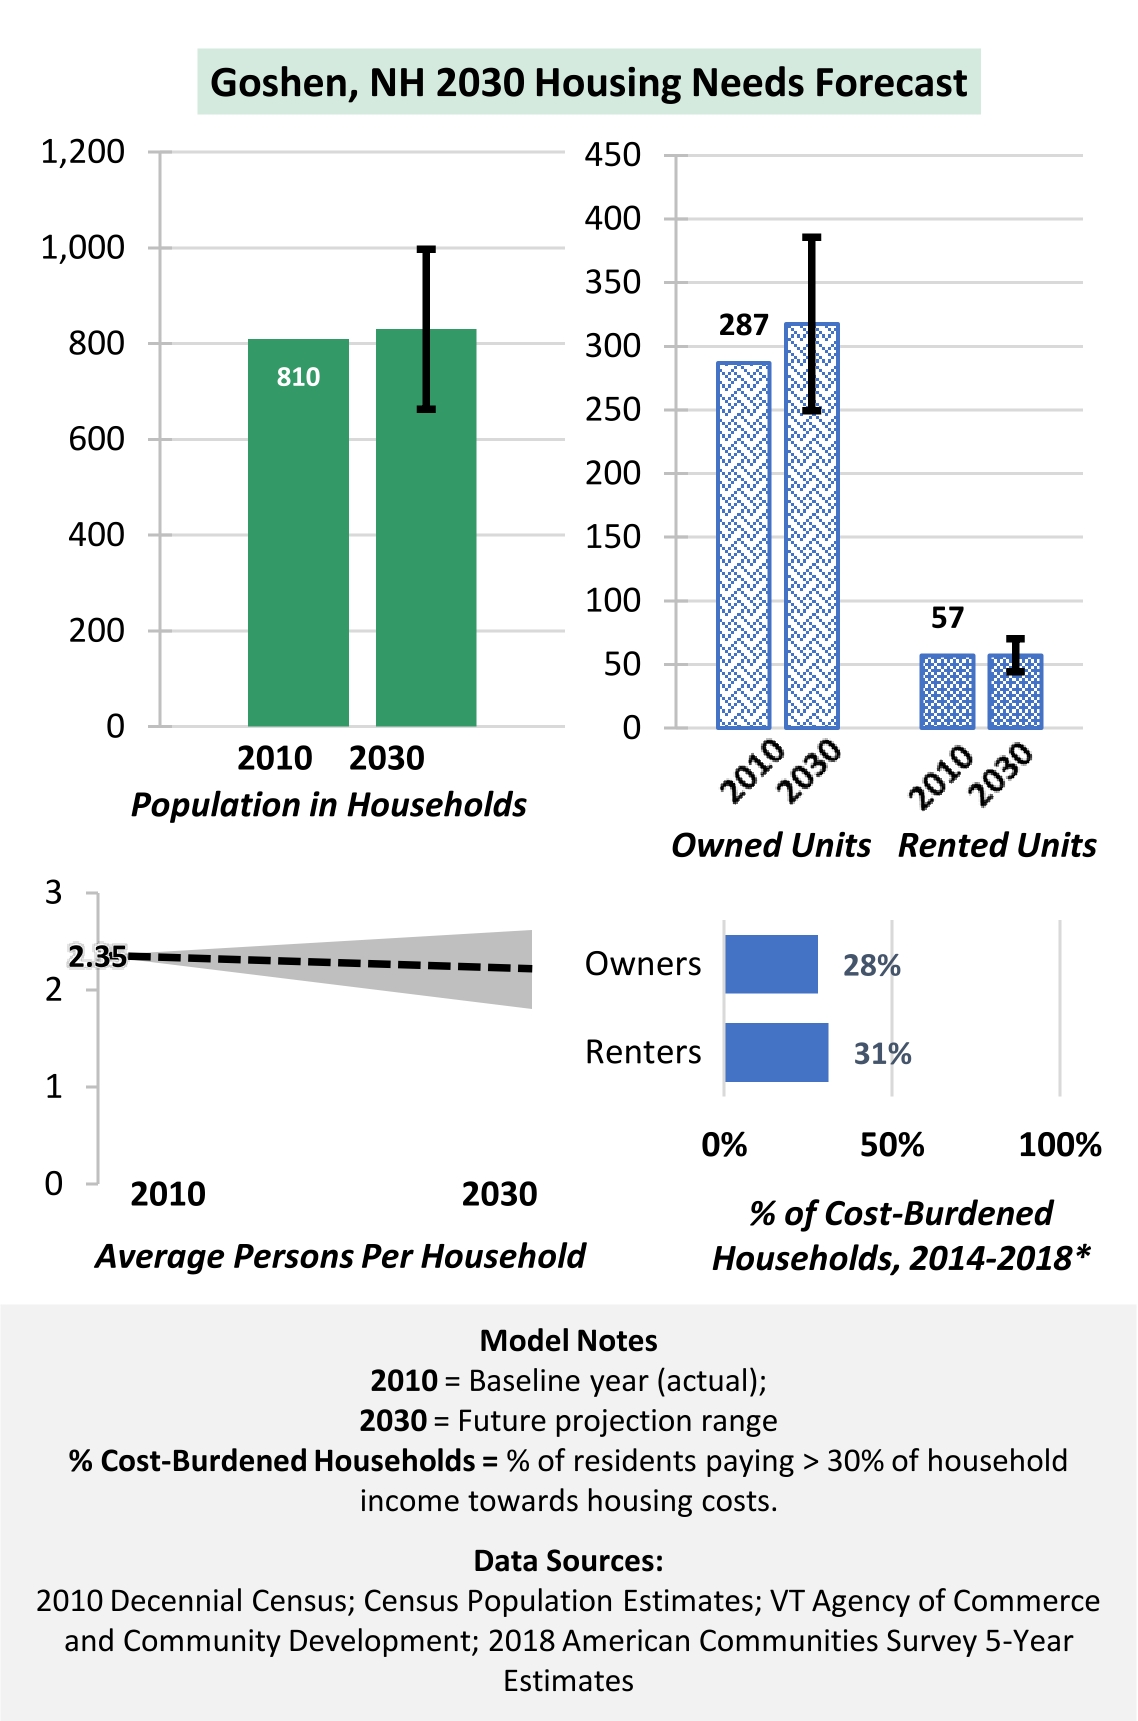
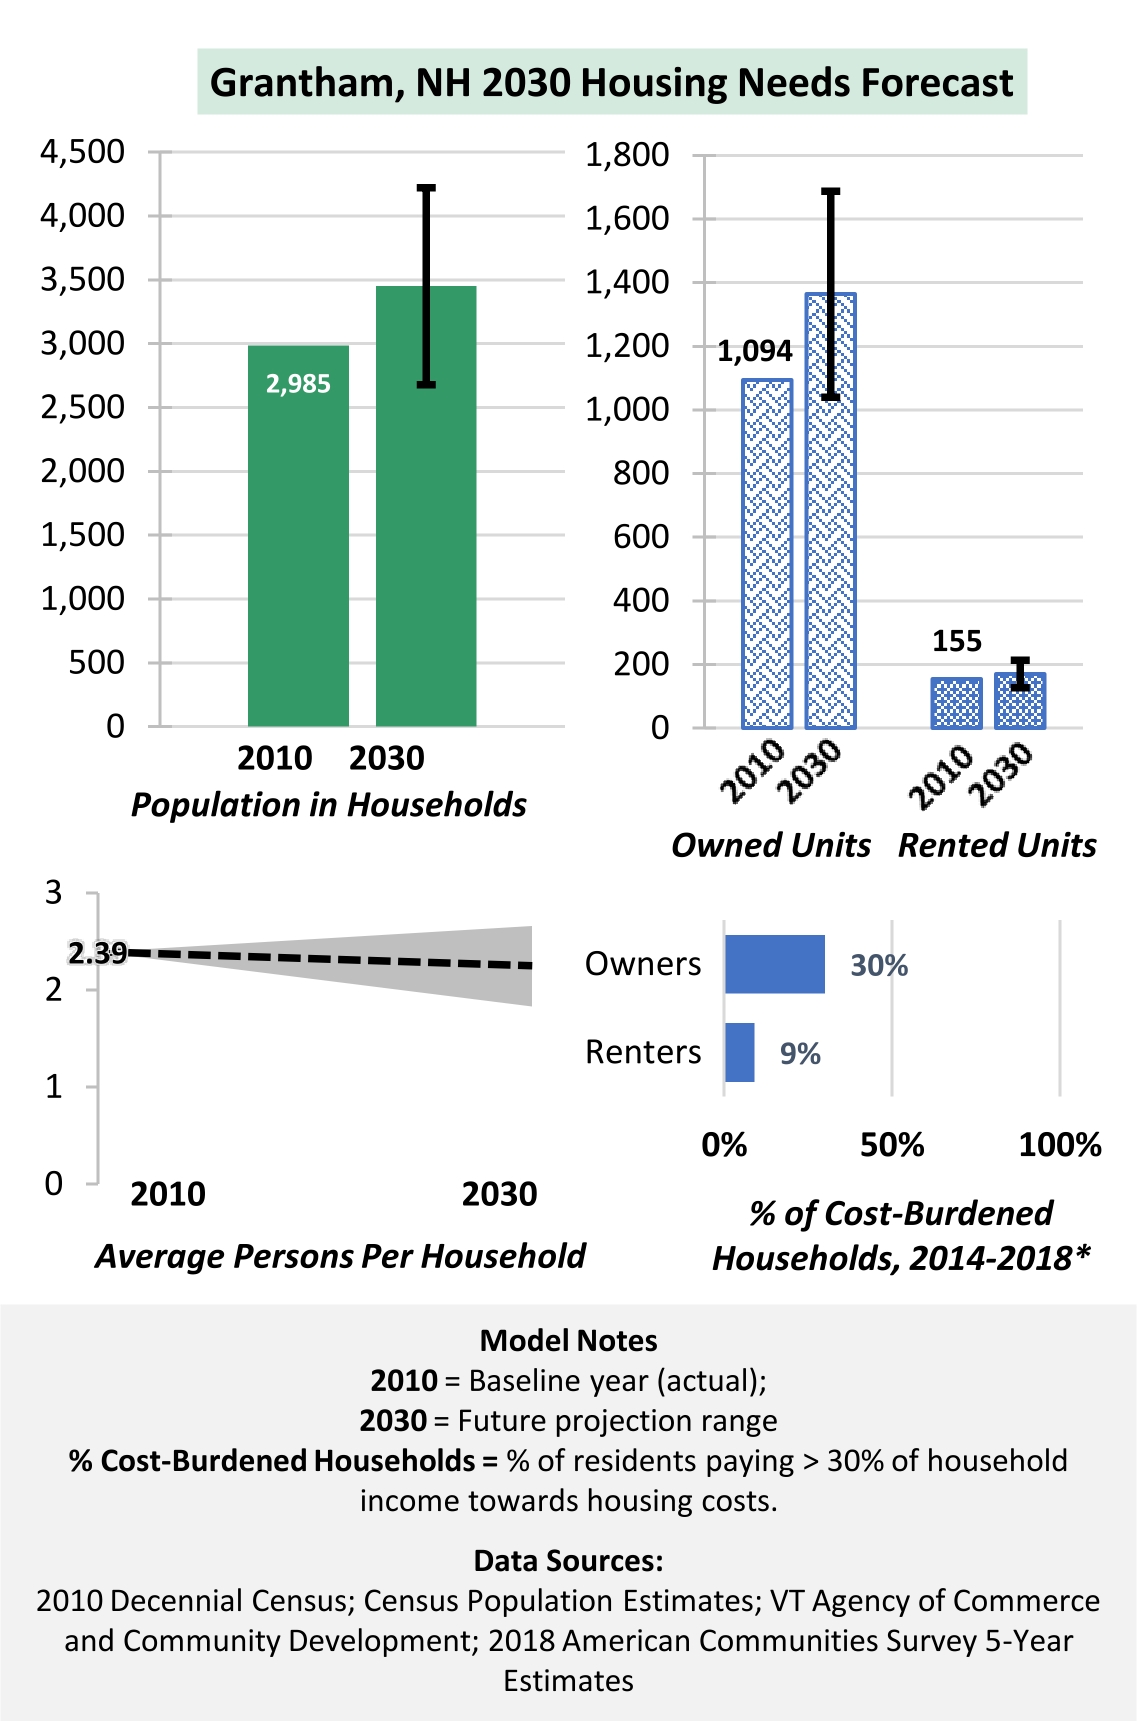
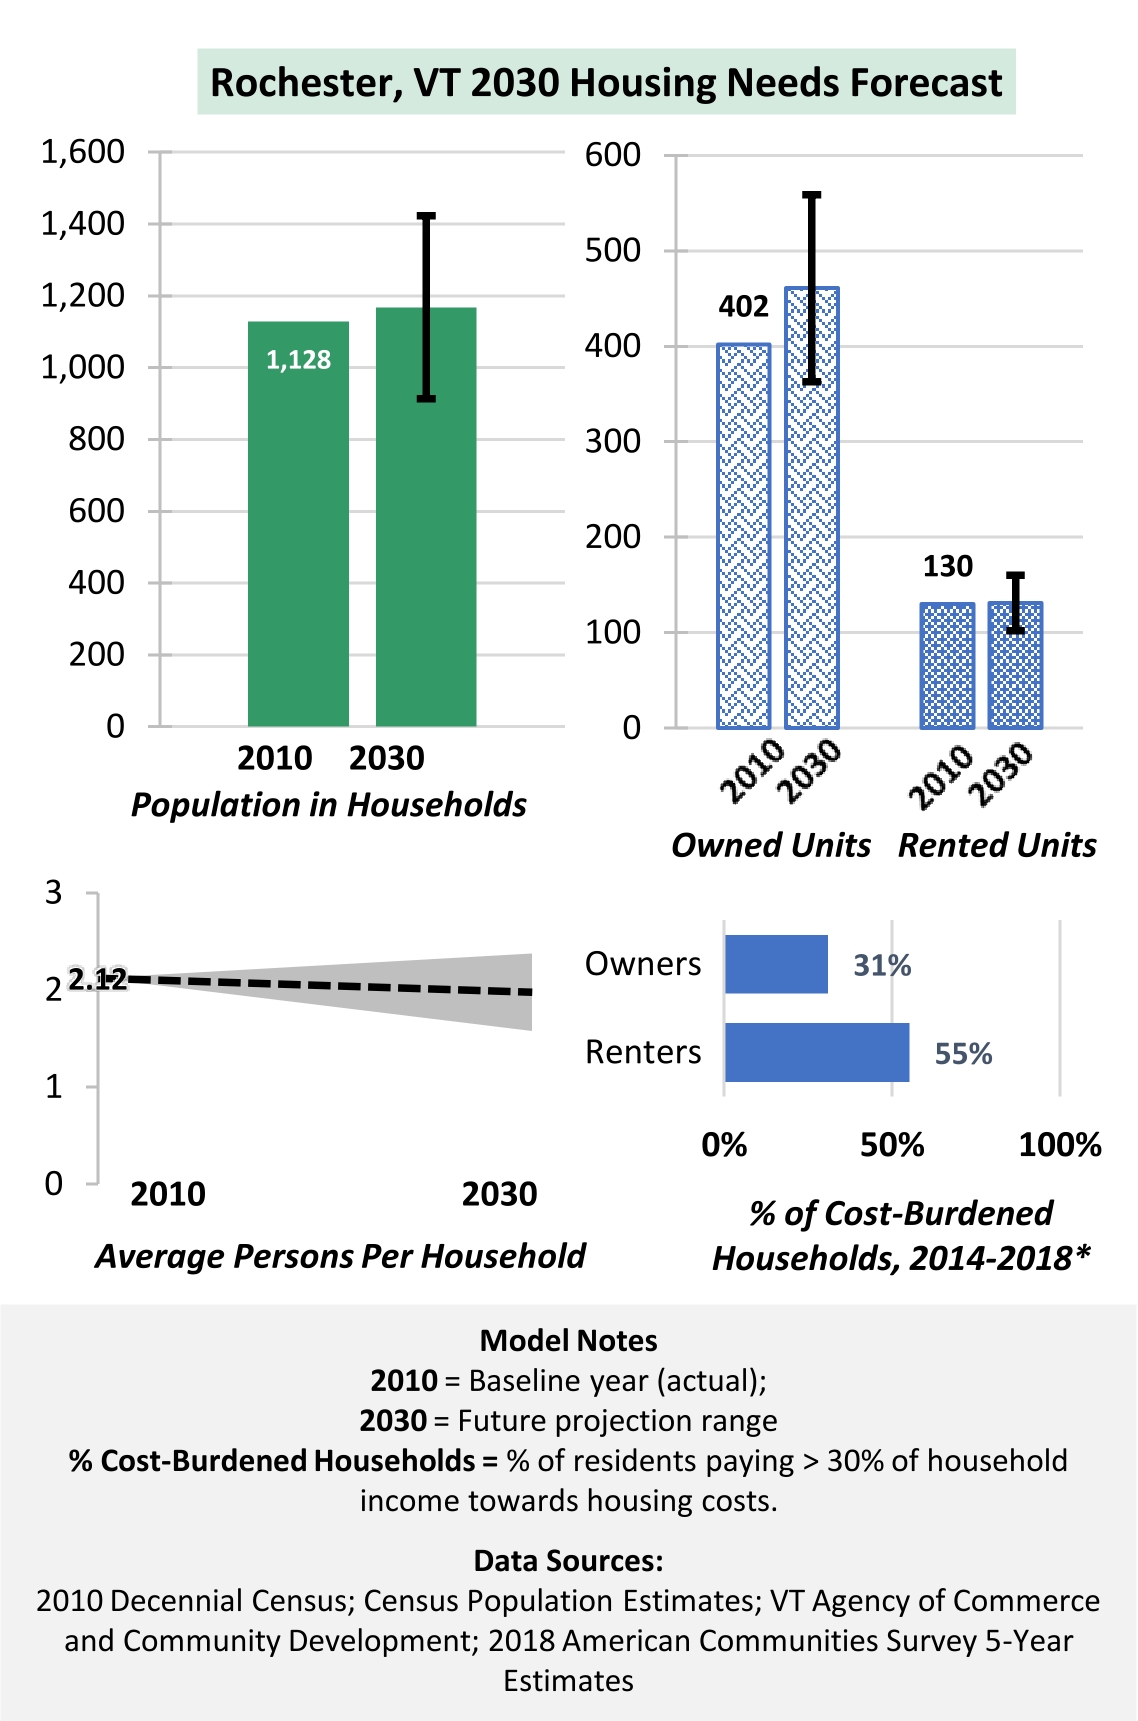
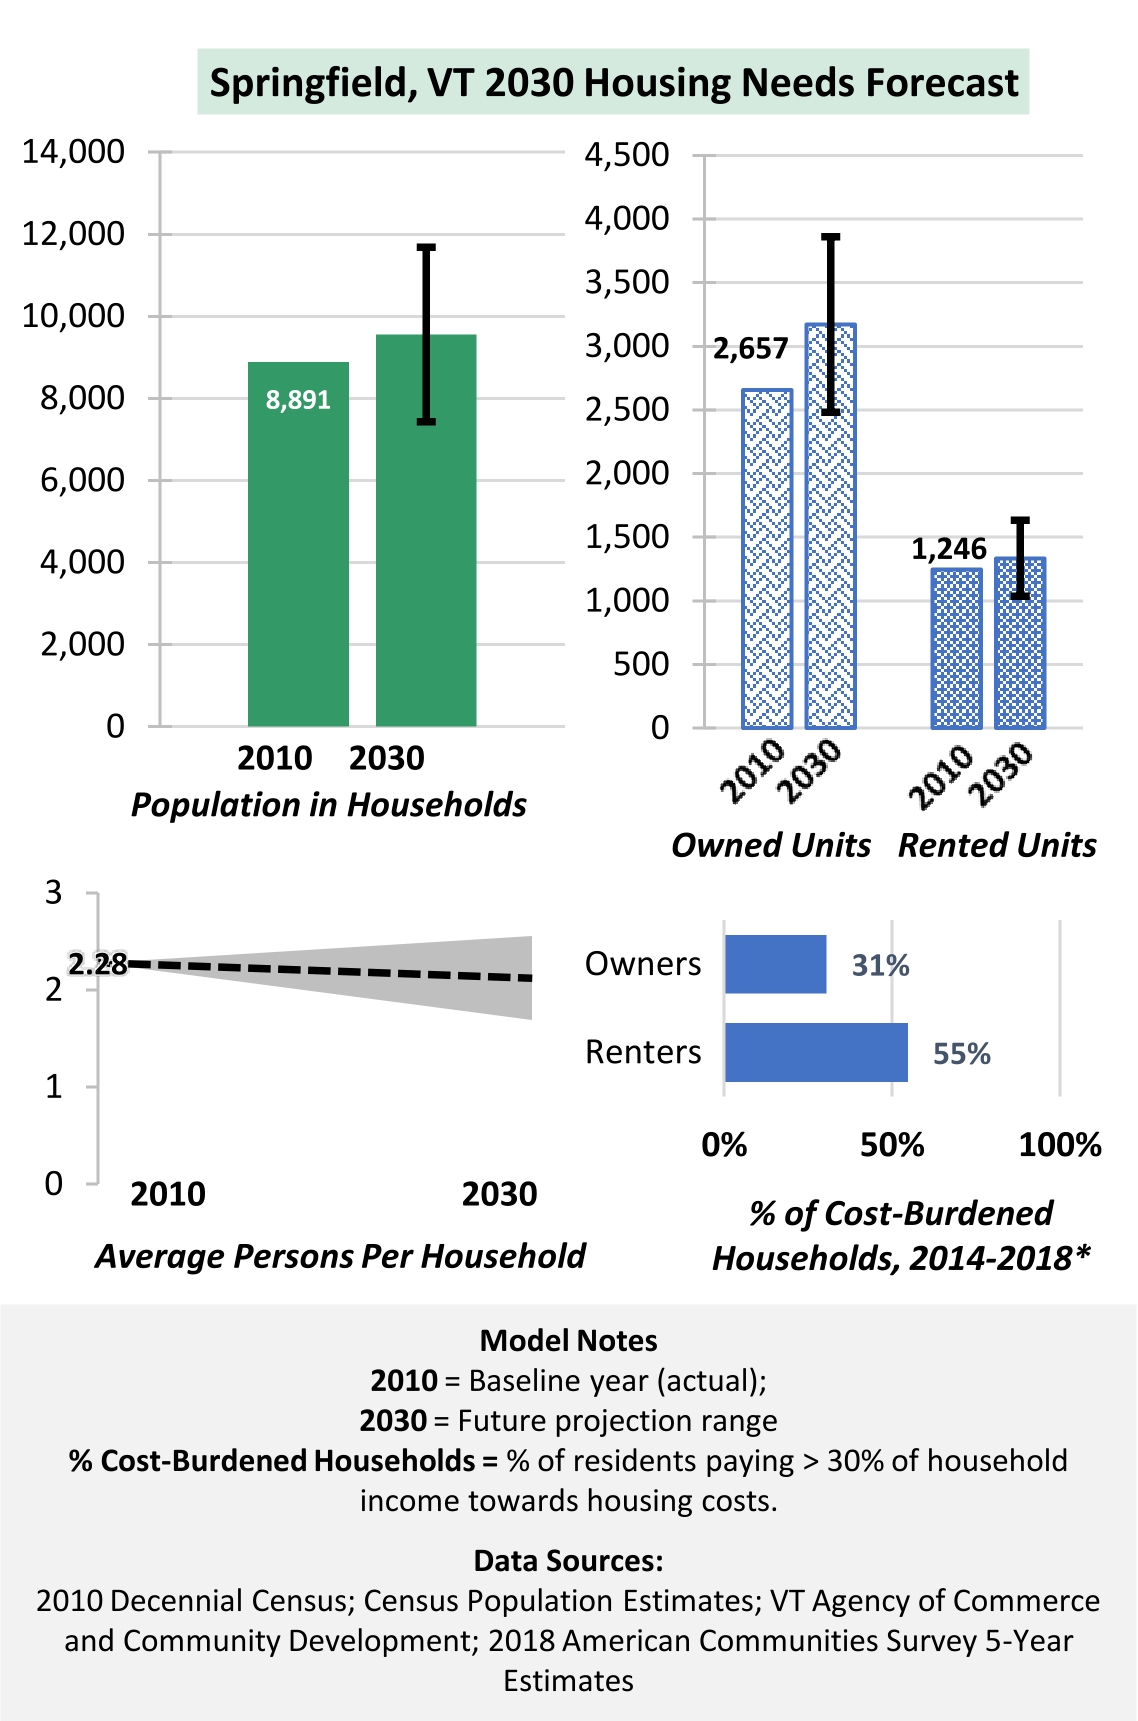
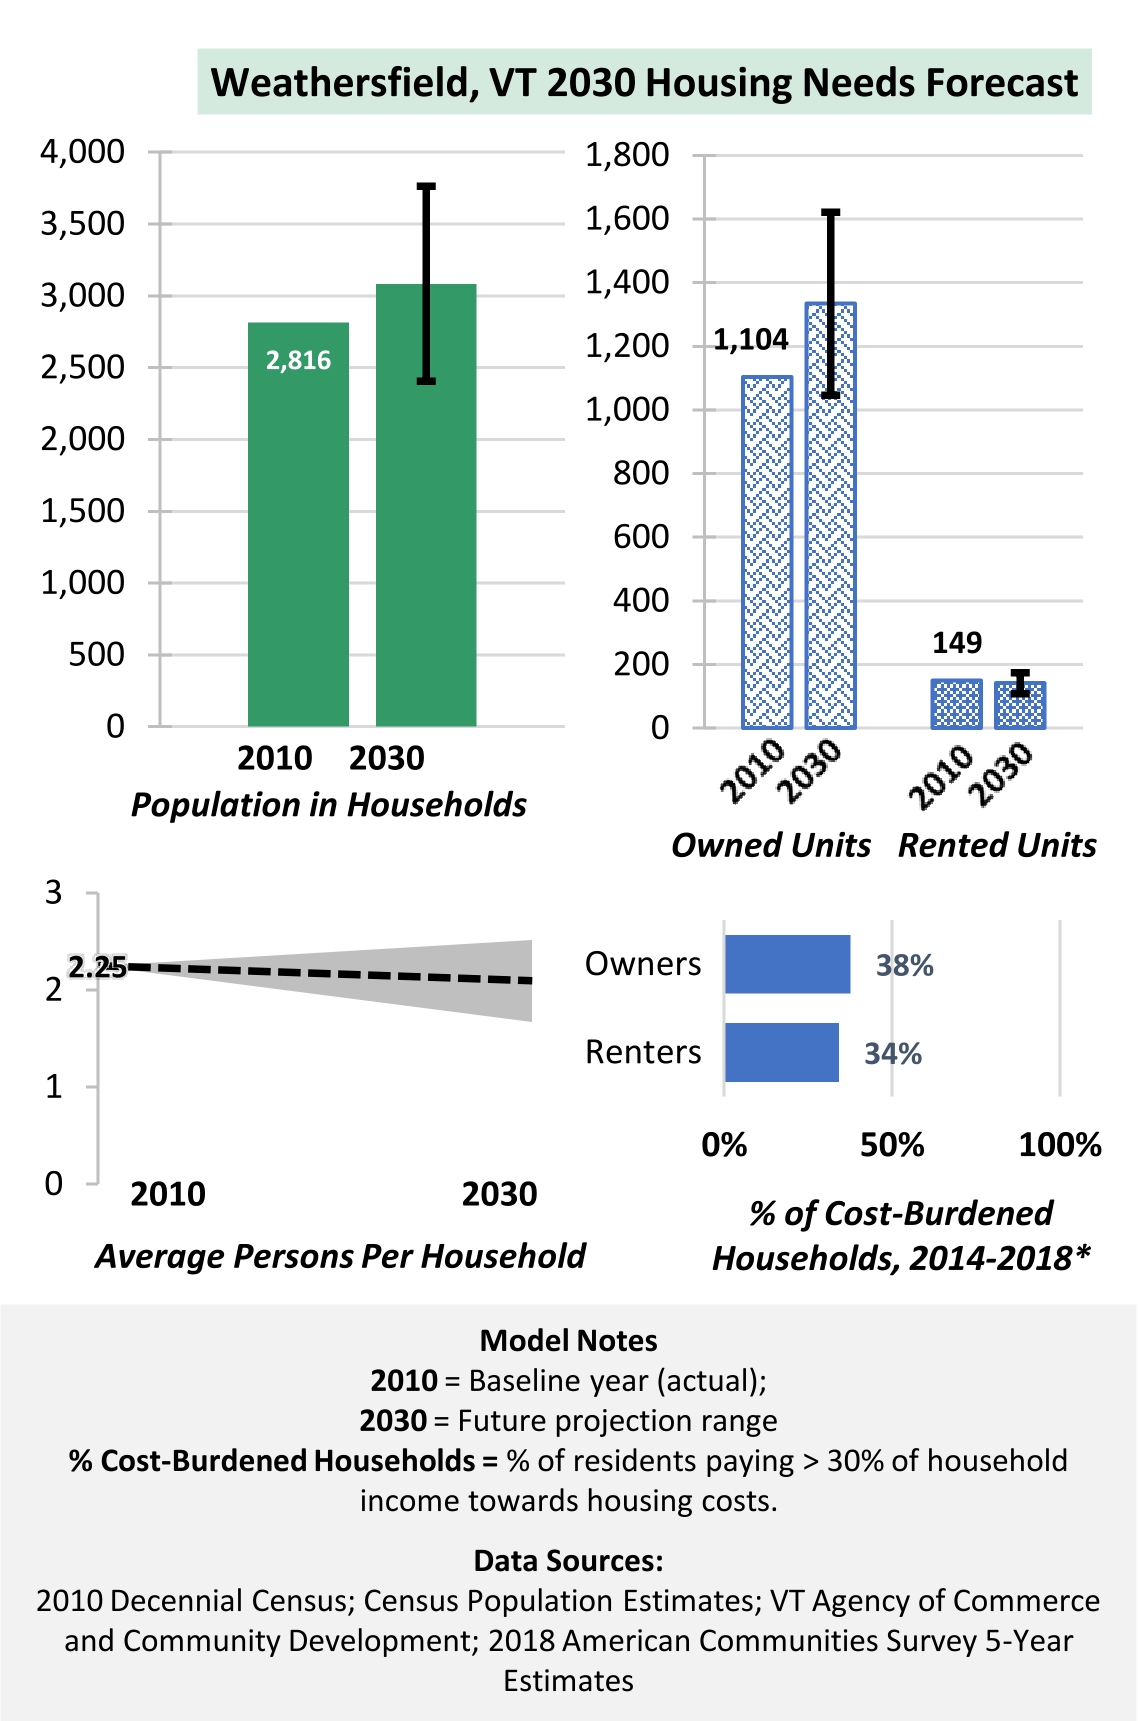
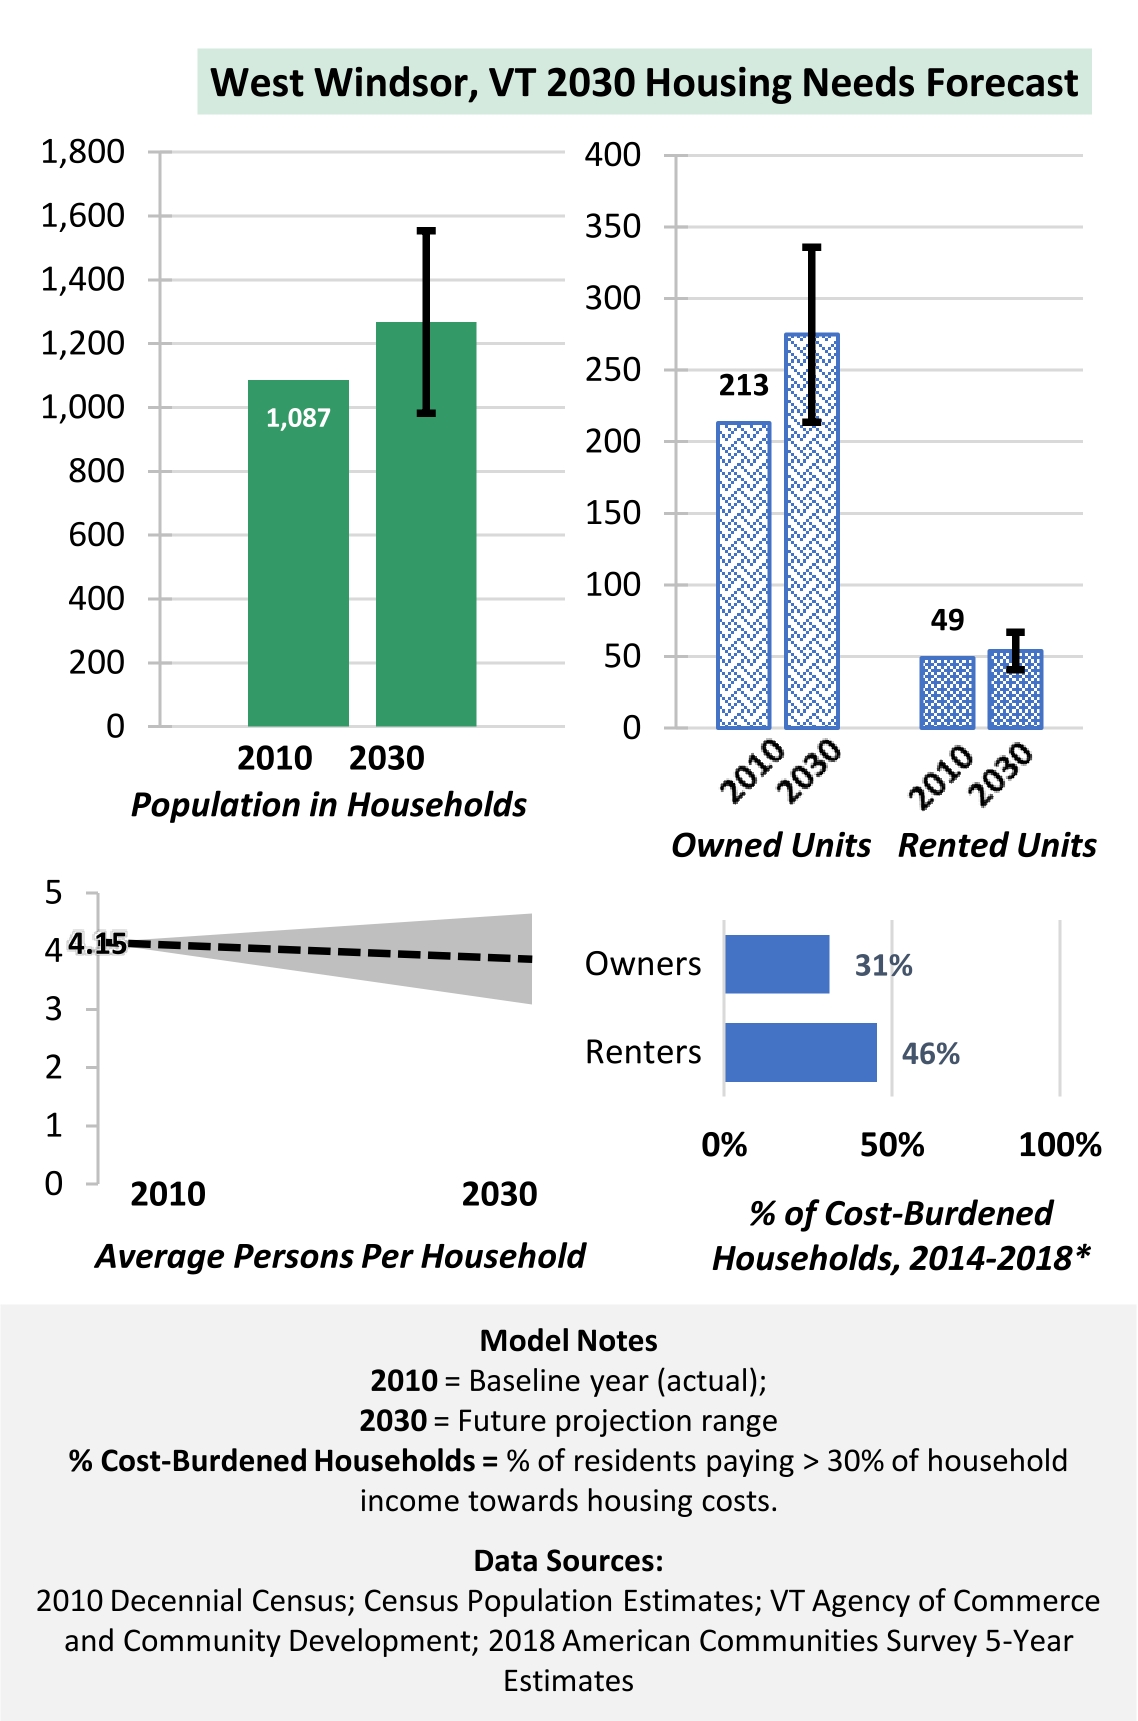
Beyond the estimated ~10,000 homes that will be needed to meet increased demand, many additional lower-priced homes and affordability programs are needed to reduce housing cost burdens for residents. From 2013 to 2017, about one-third of greater Upper Valley region households were cost-burdened, meaning they paid more than 30% of household income towards housing costs (mortgage, rent, etc). If current levels of cost burden continue, by 2030 there will be approximately 26,000 cost-burdened households in the region. In other words, if current trends continue, by 2030 there will be approximately 26,000 households that would benefit significantly from more affordable home options and/or financial support.
Planning and Policy Implications:
- Dedicated programs for delivering affordable home prices and/or financial support are needed (in addition to building new affordable homes).
- Providing a balanced array of housing types will help address cost-burden challenges. Ensuring a variety of home sizes and prices will help provide residents with housing options that are appropriate for households of different sizes and income levels.
- Transportation costs also contribute to affordability challenges for greater Upper Valley region residents. Providing home options with better accessibility to destinations via public transit, walking, and bicycling will help reduce cost burdens for residents.
Key Result #3 – An aging population will increase demand for smaller homes.
The average household size in the greater Upper Valley region is projected to shrink from 2.30 people per household to 2.14 people per household. This is largely due to the continued aging of the region’s population, as older residents tend to have smaller households.
Planning and Policy Implications:
- As the region’s population ages, demand for smaller homes will increase. A variety of housing types will be needed in order to provide needed home options for residents of all ages.
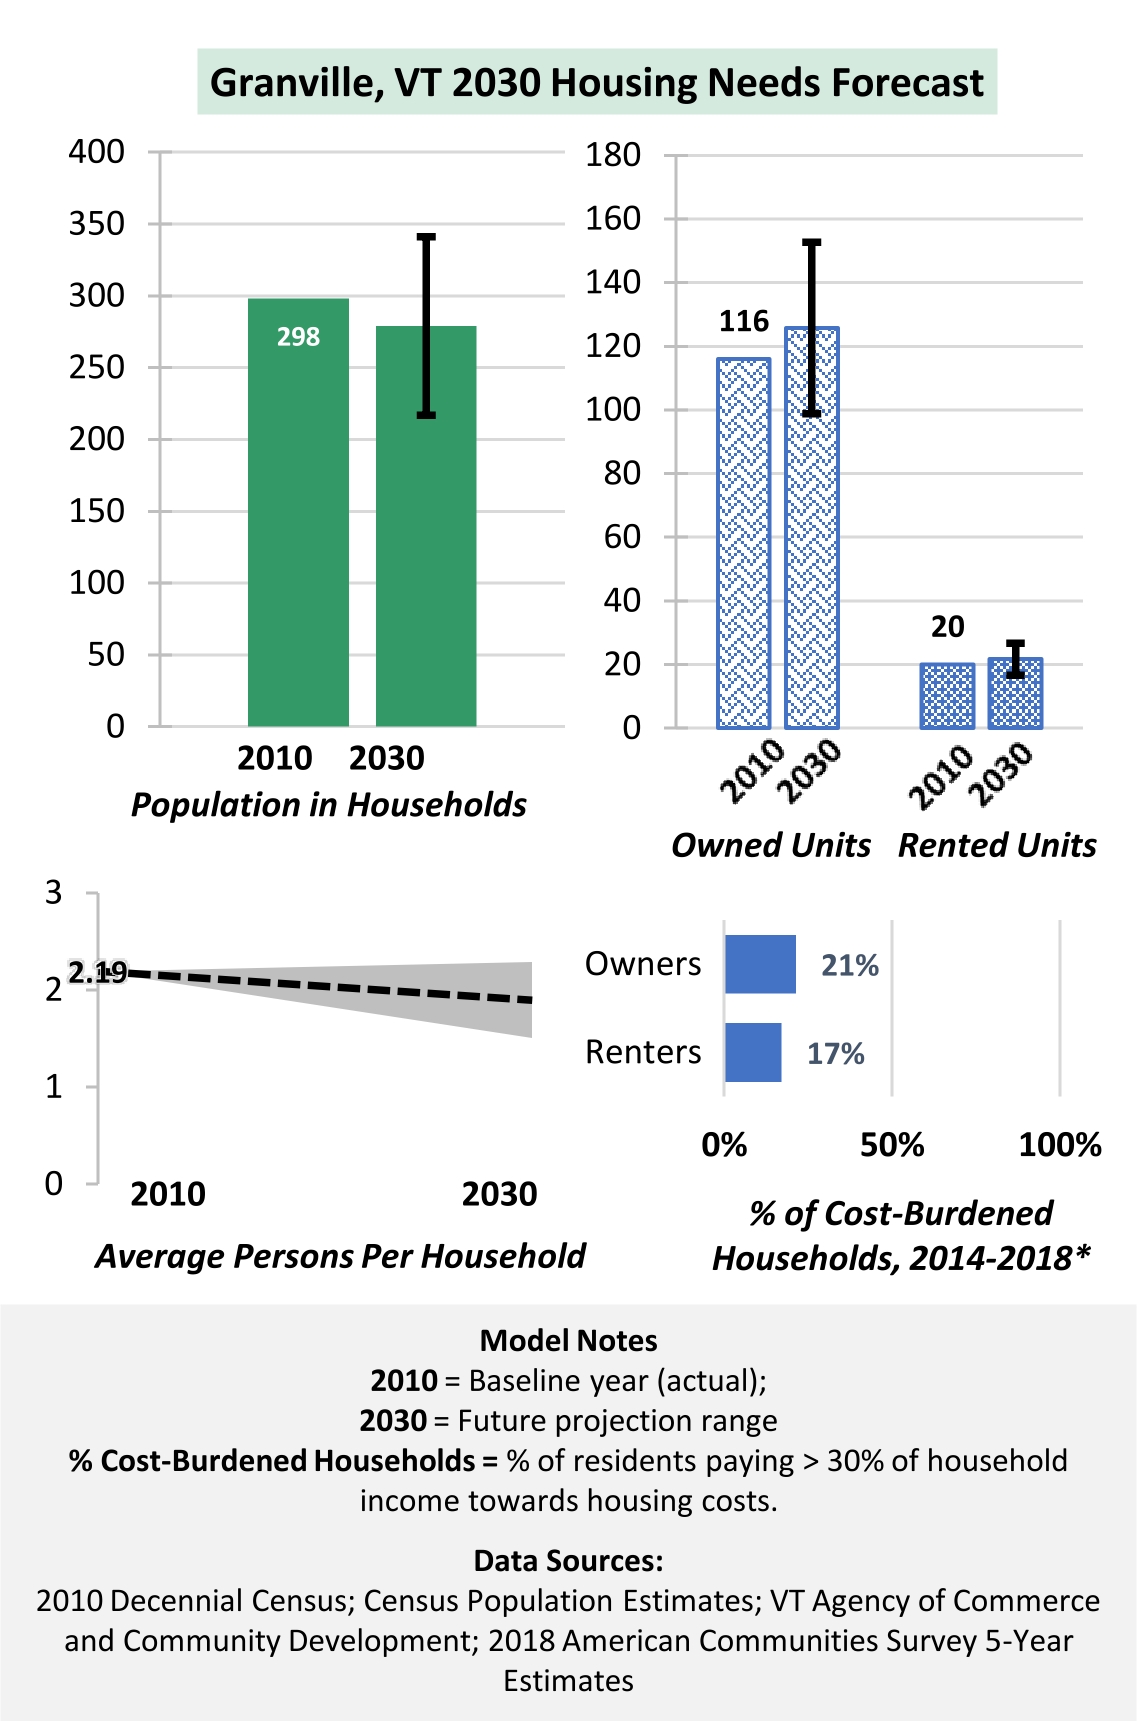
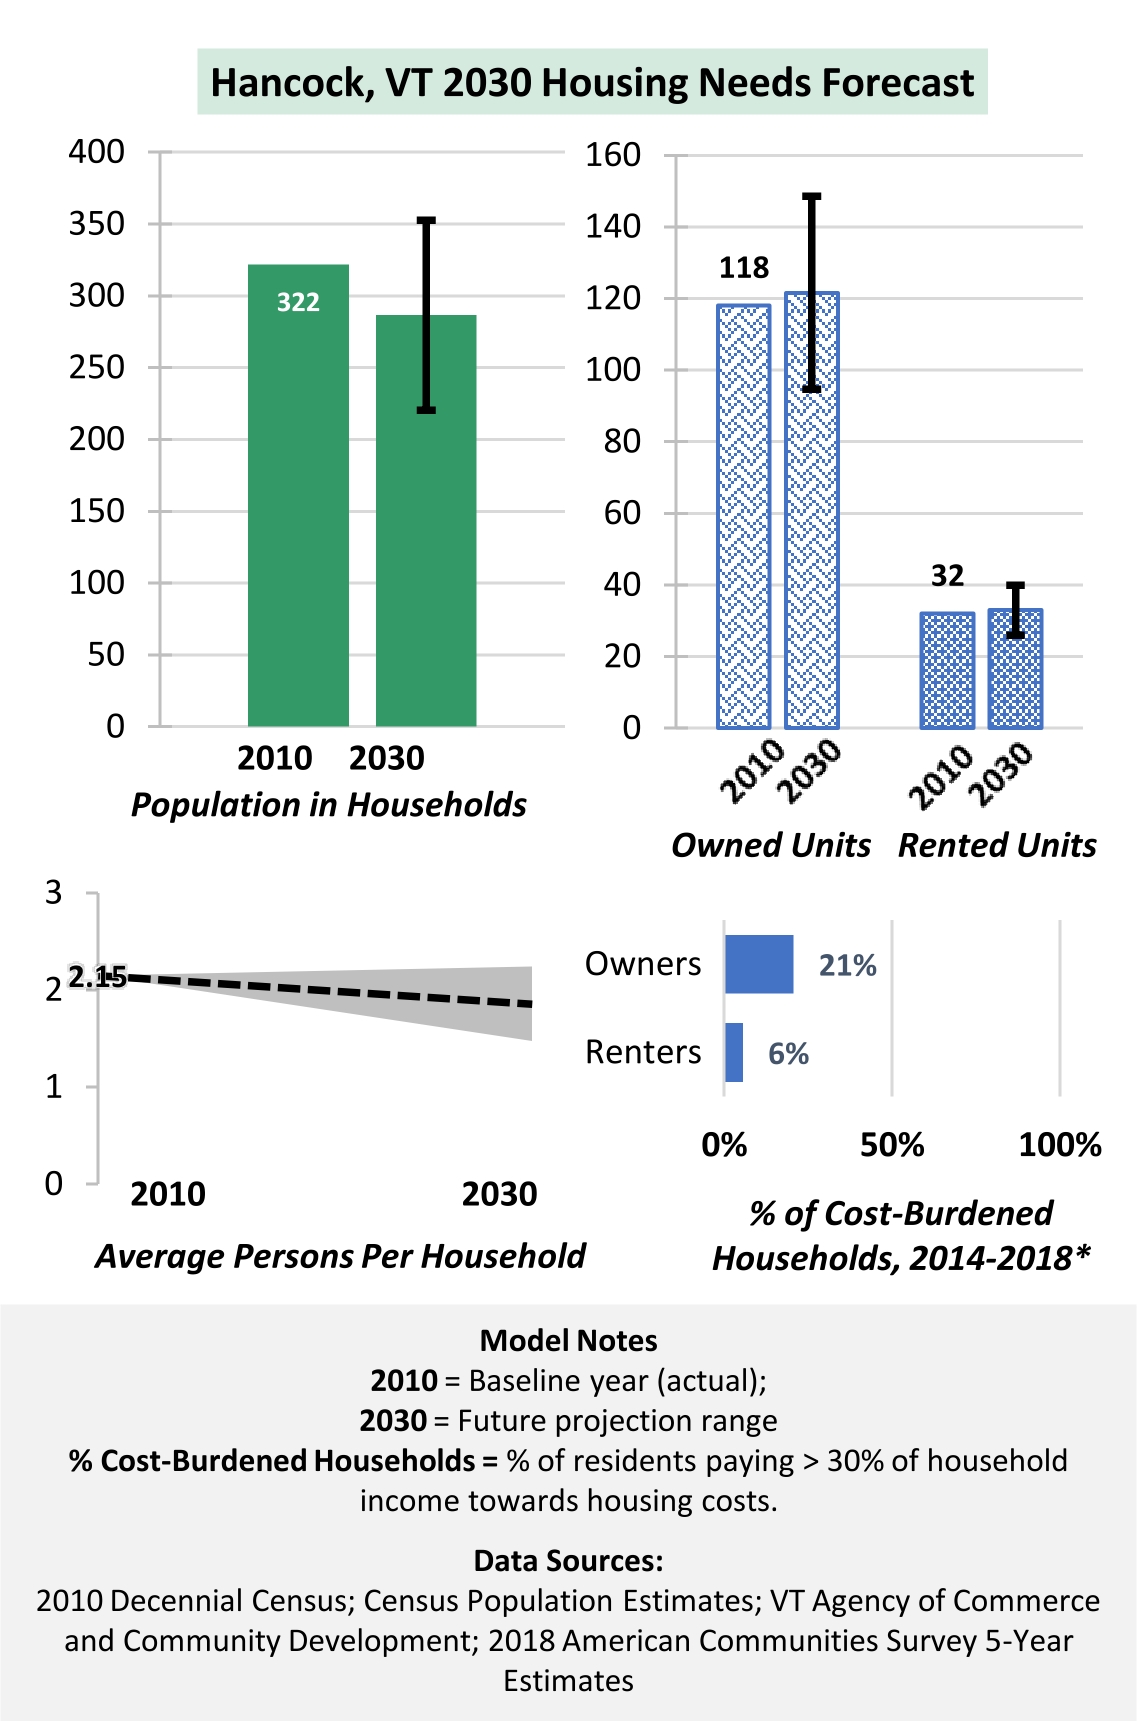
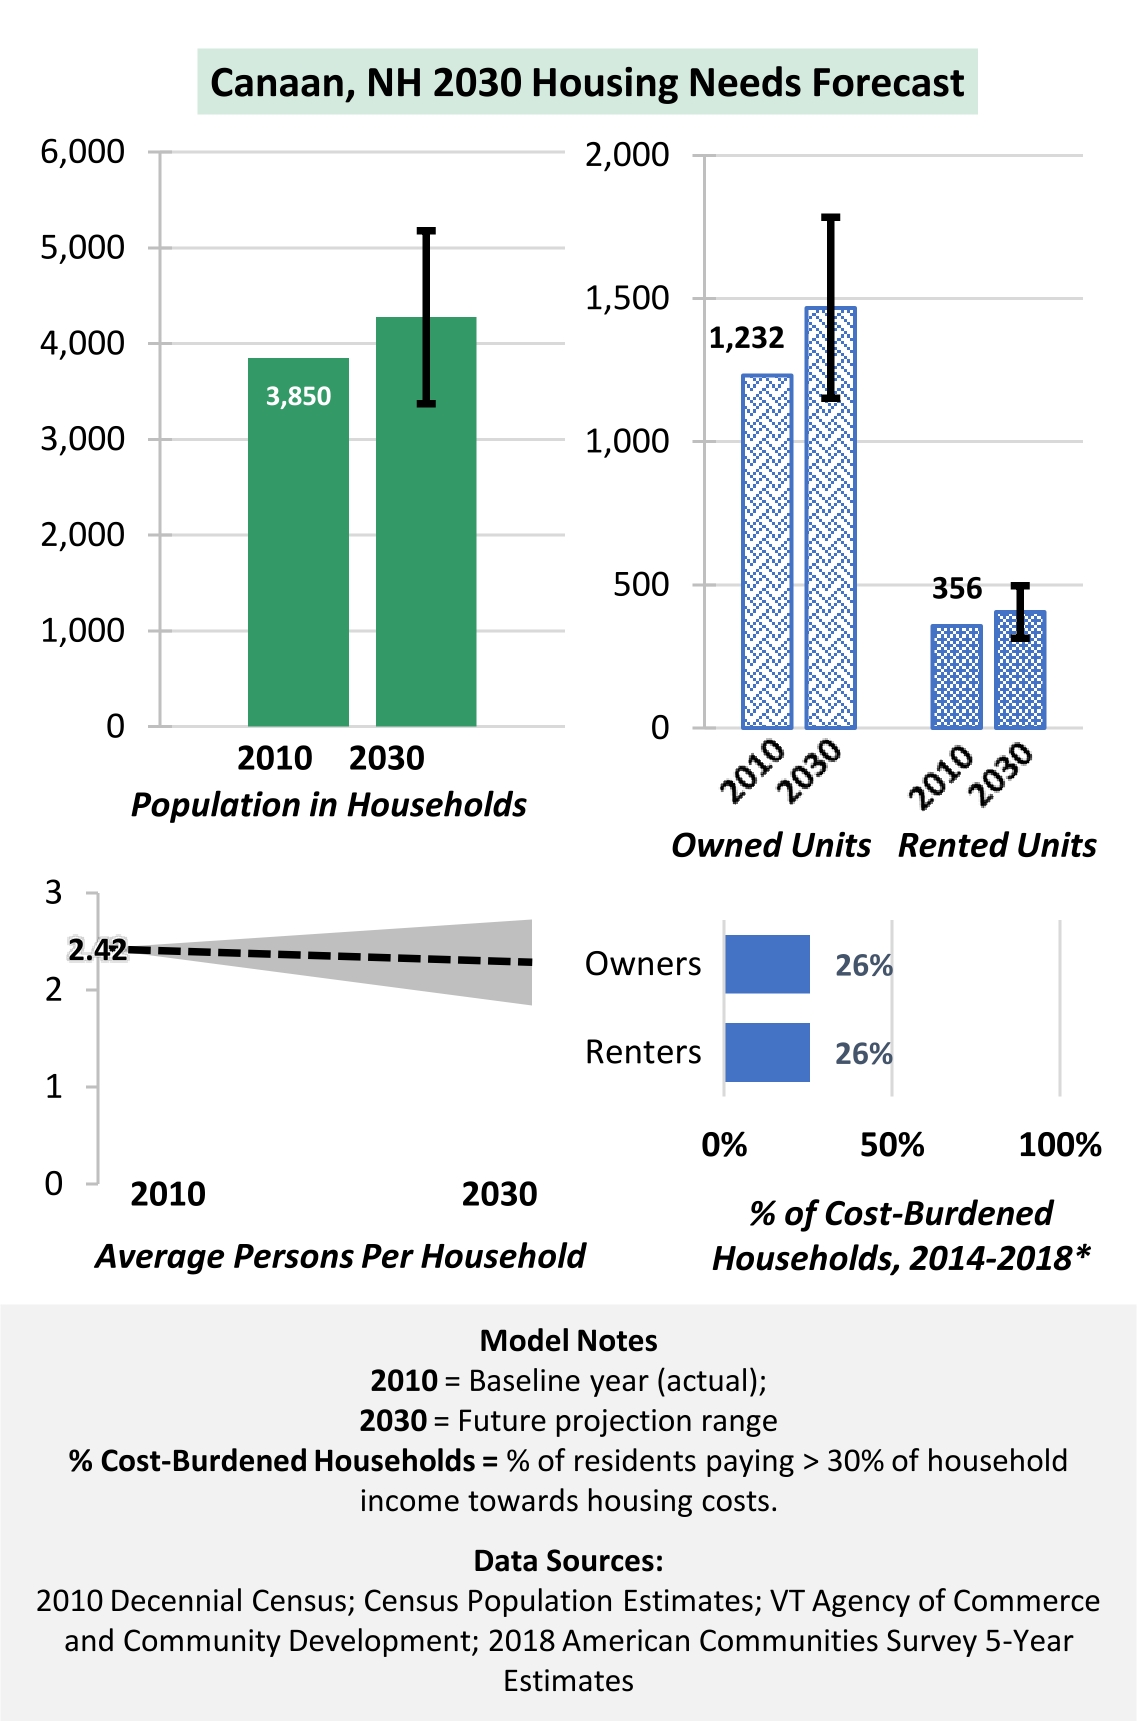
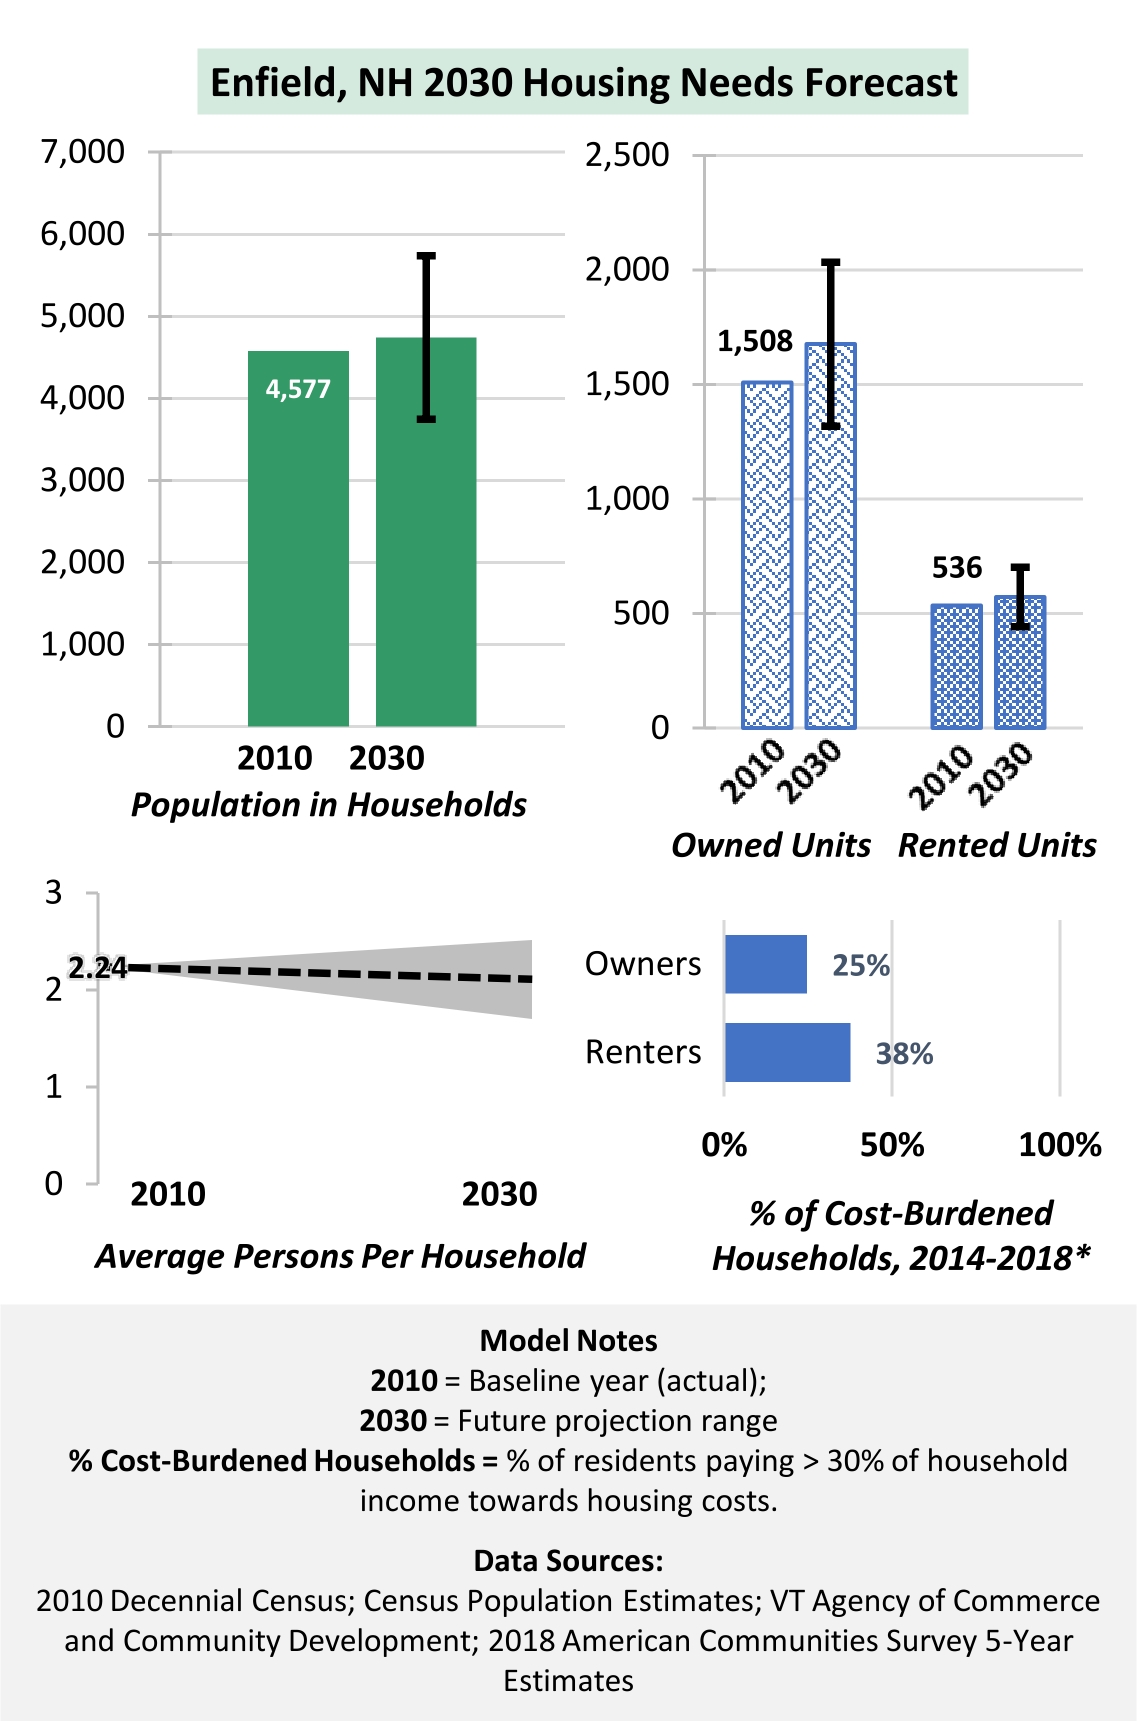
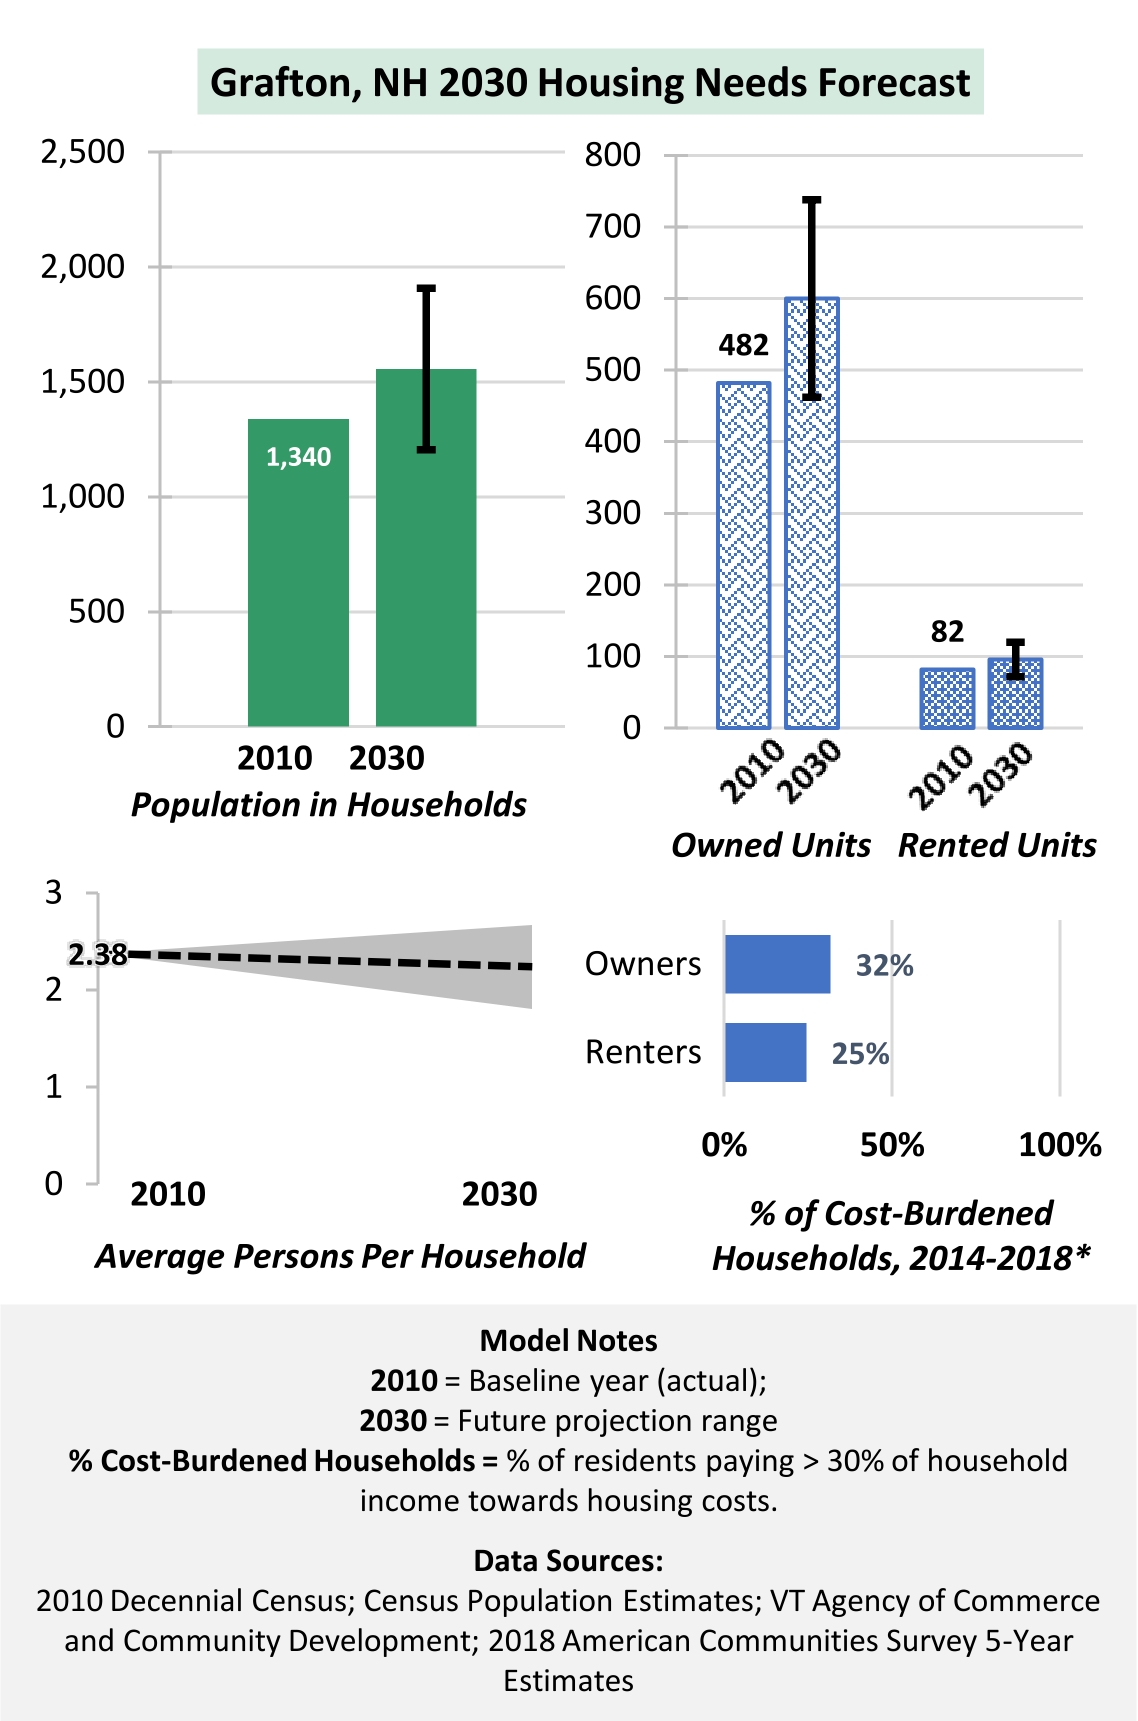
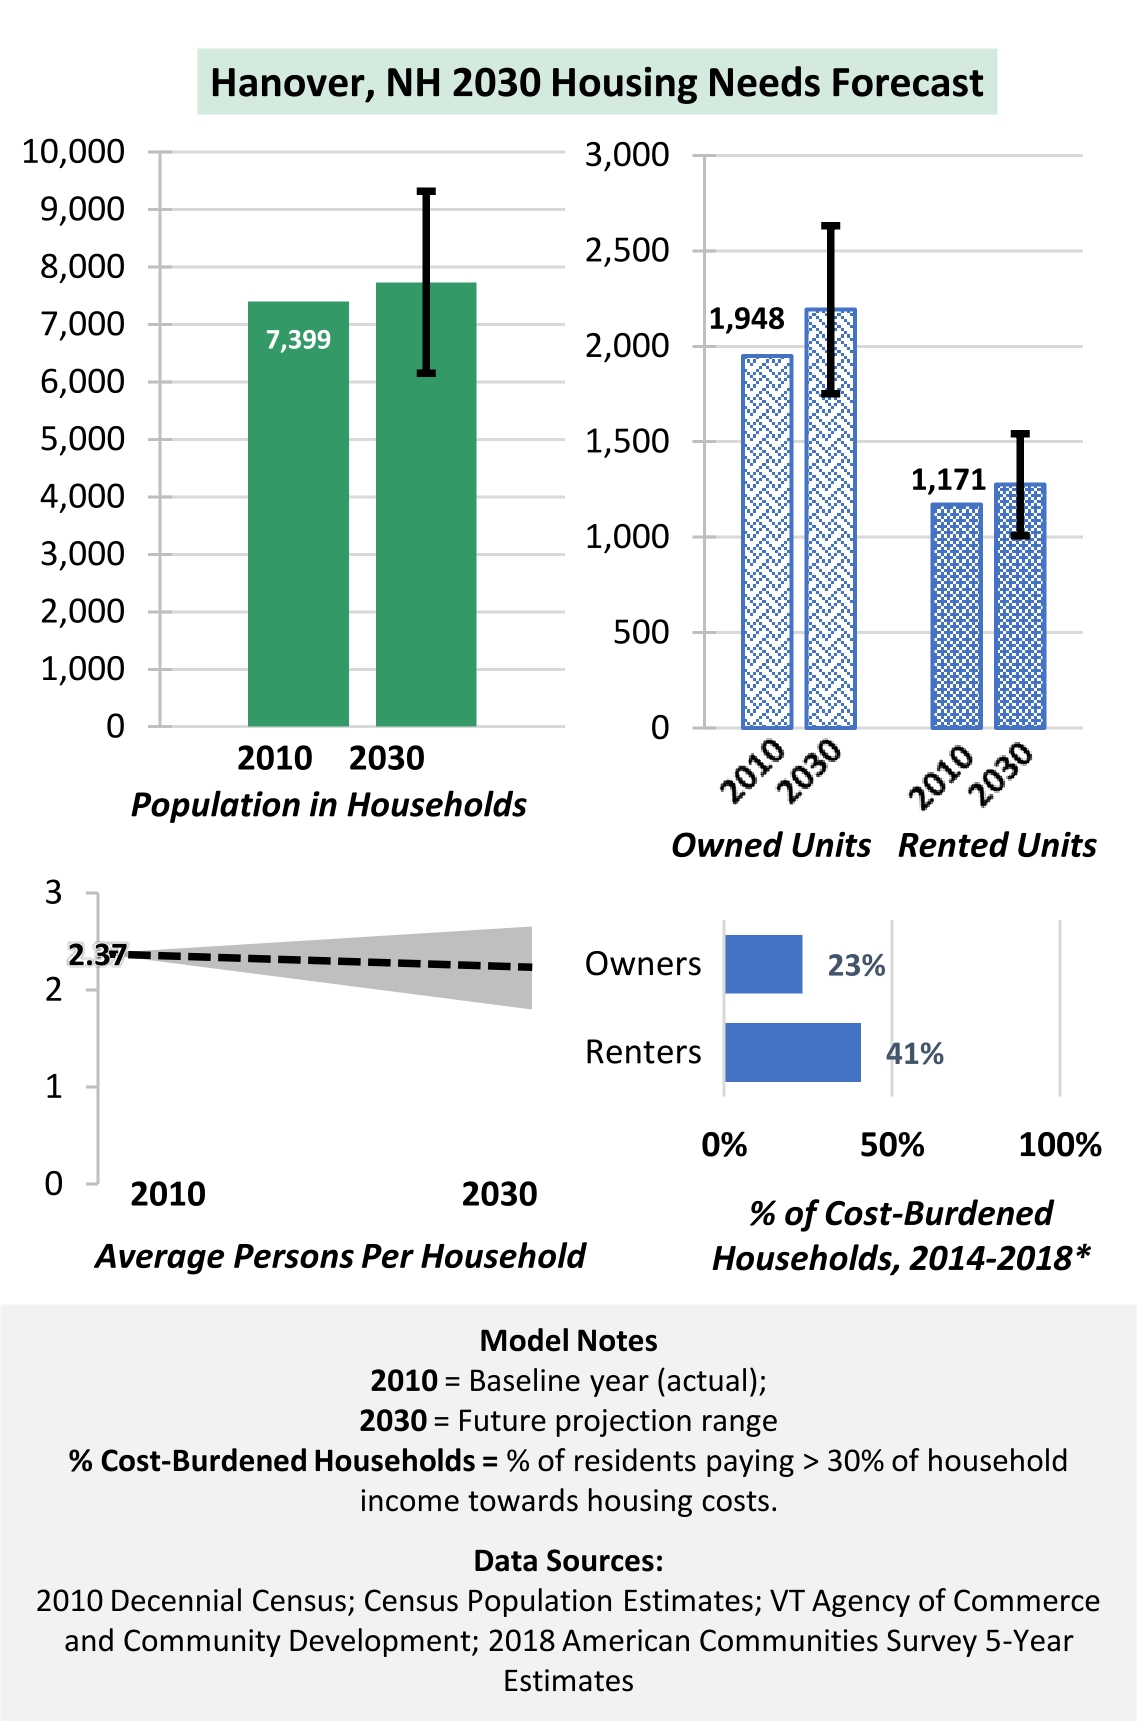
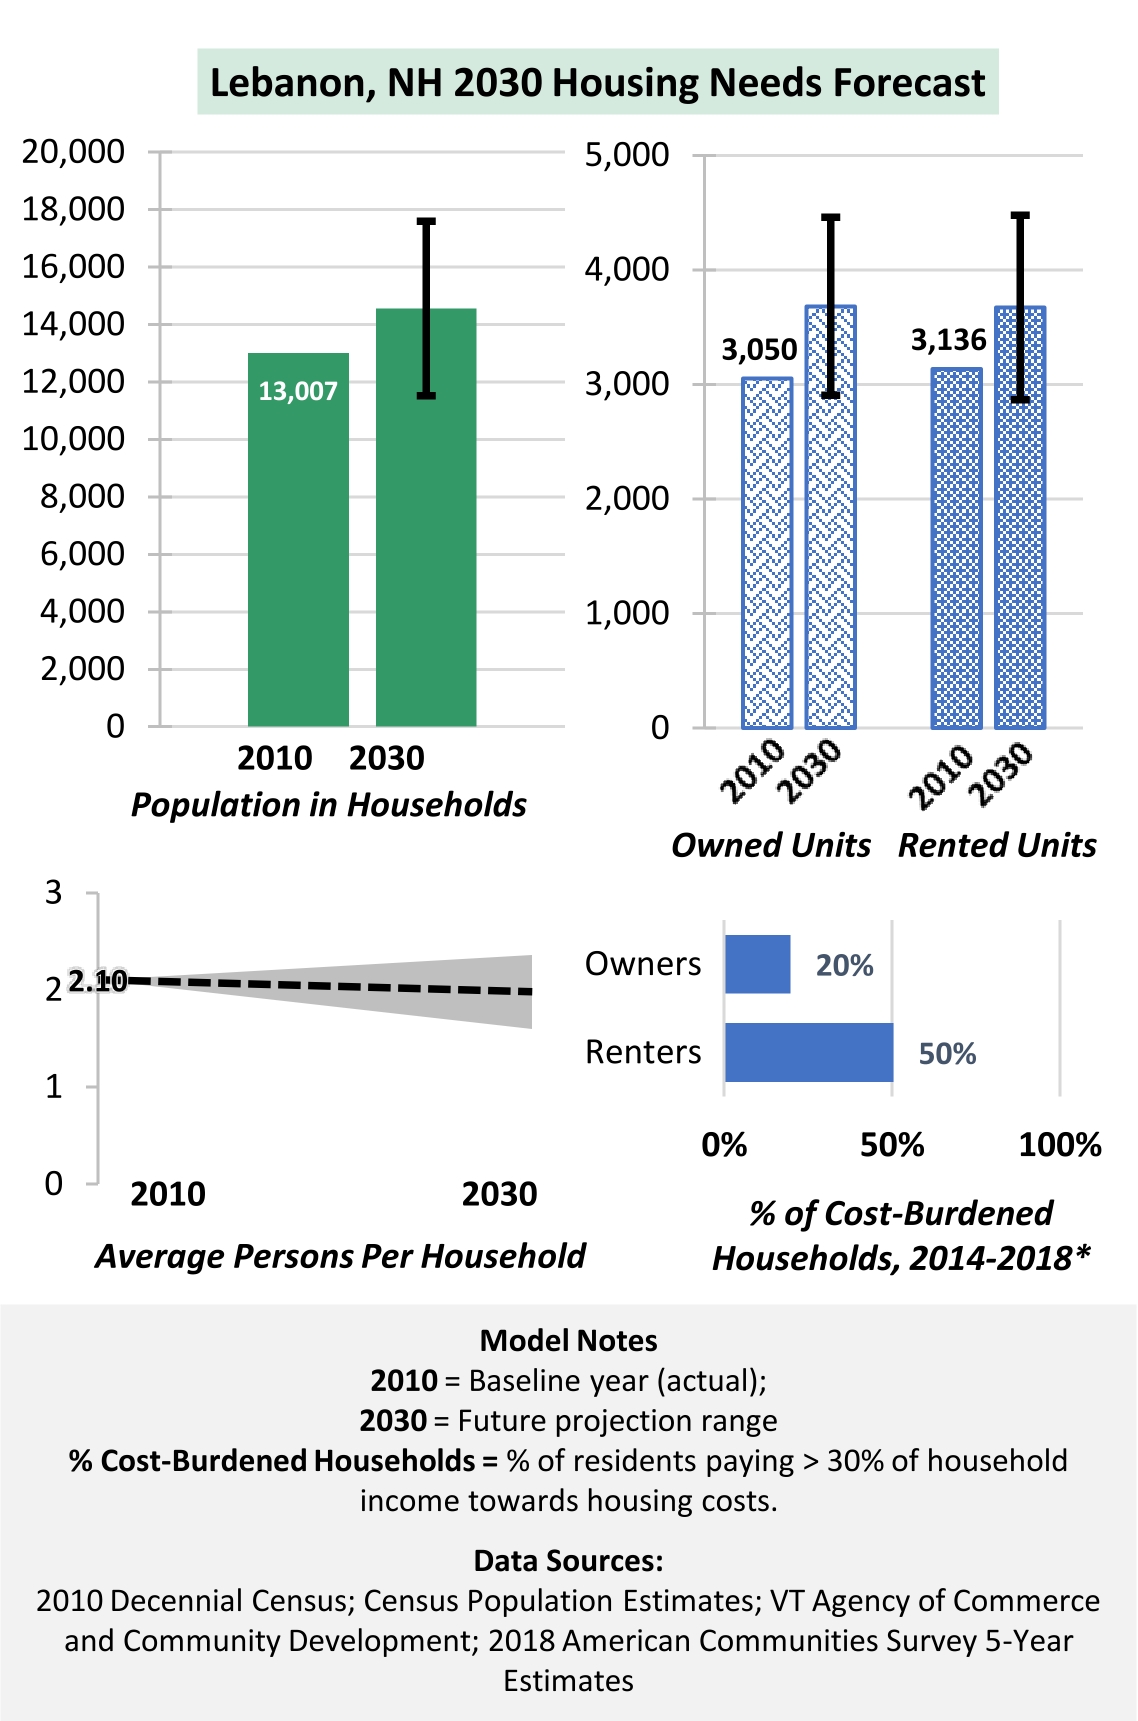
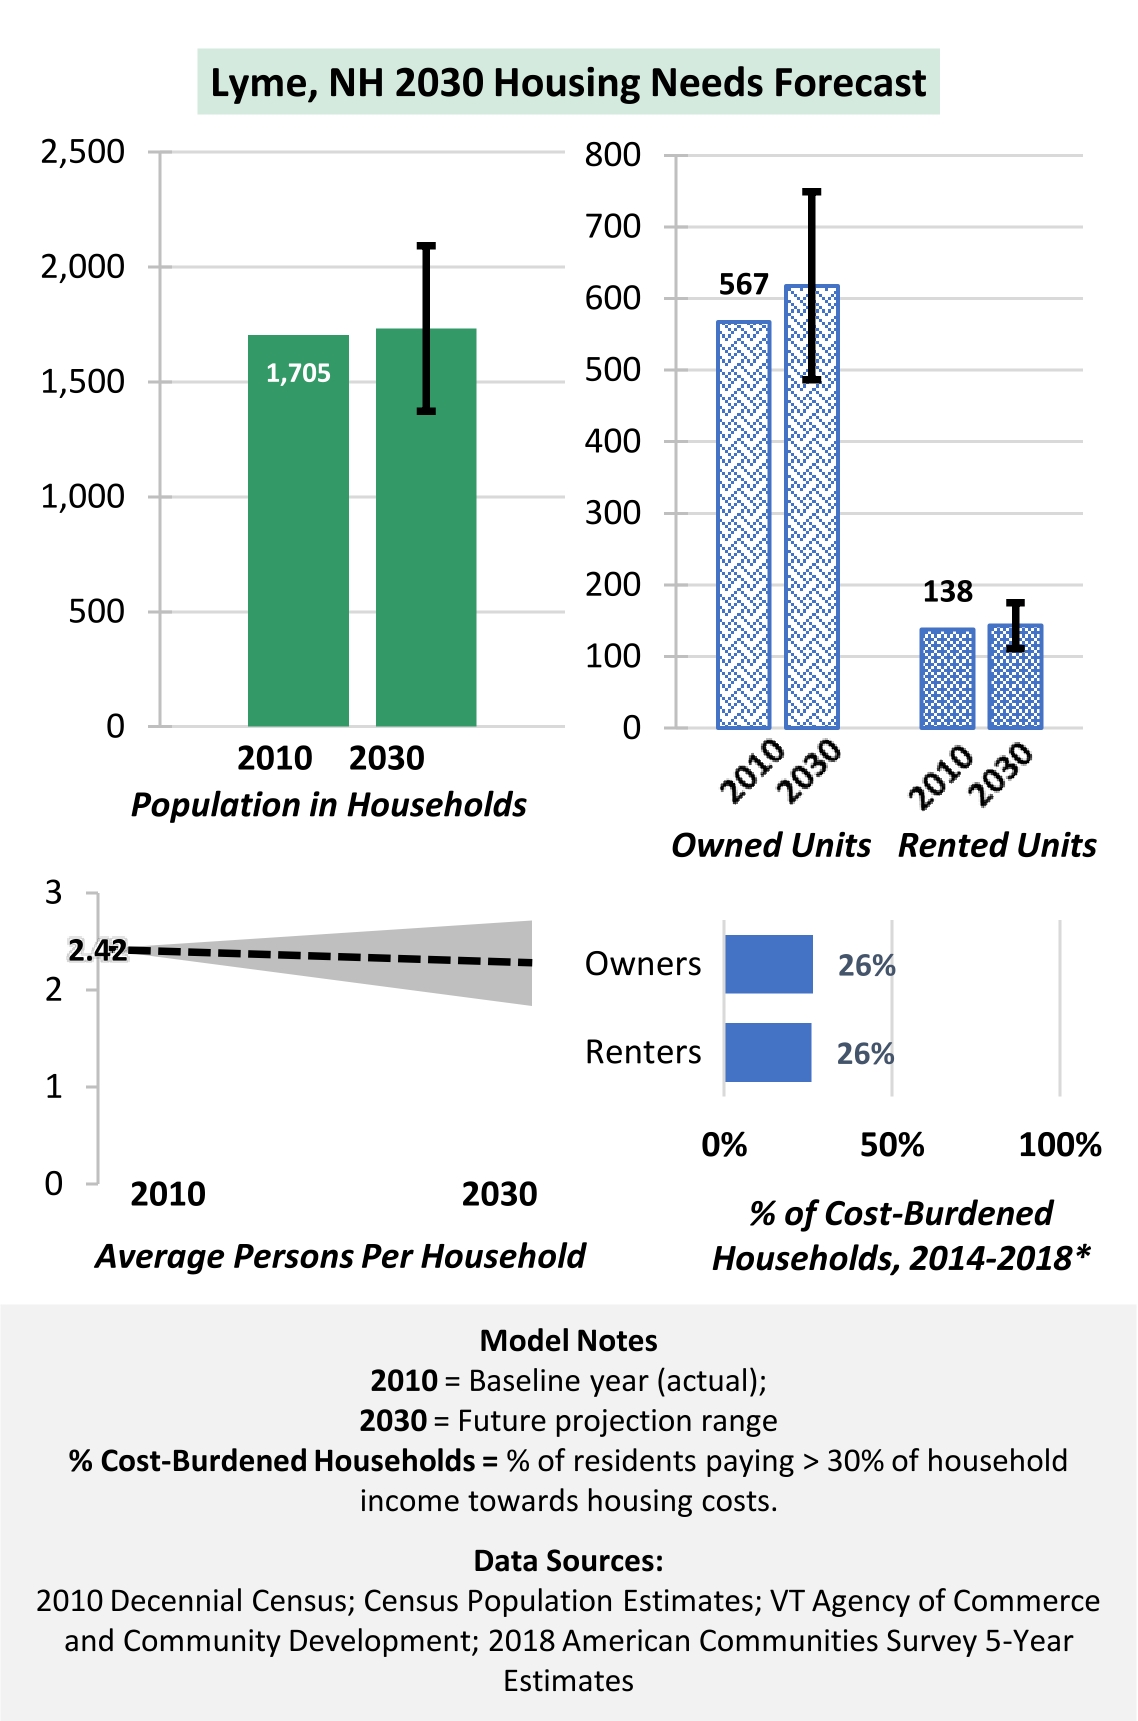
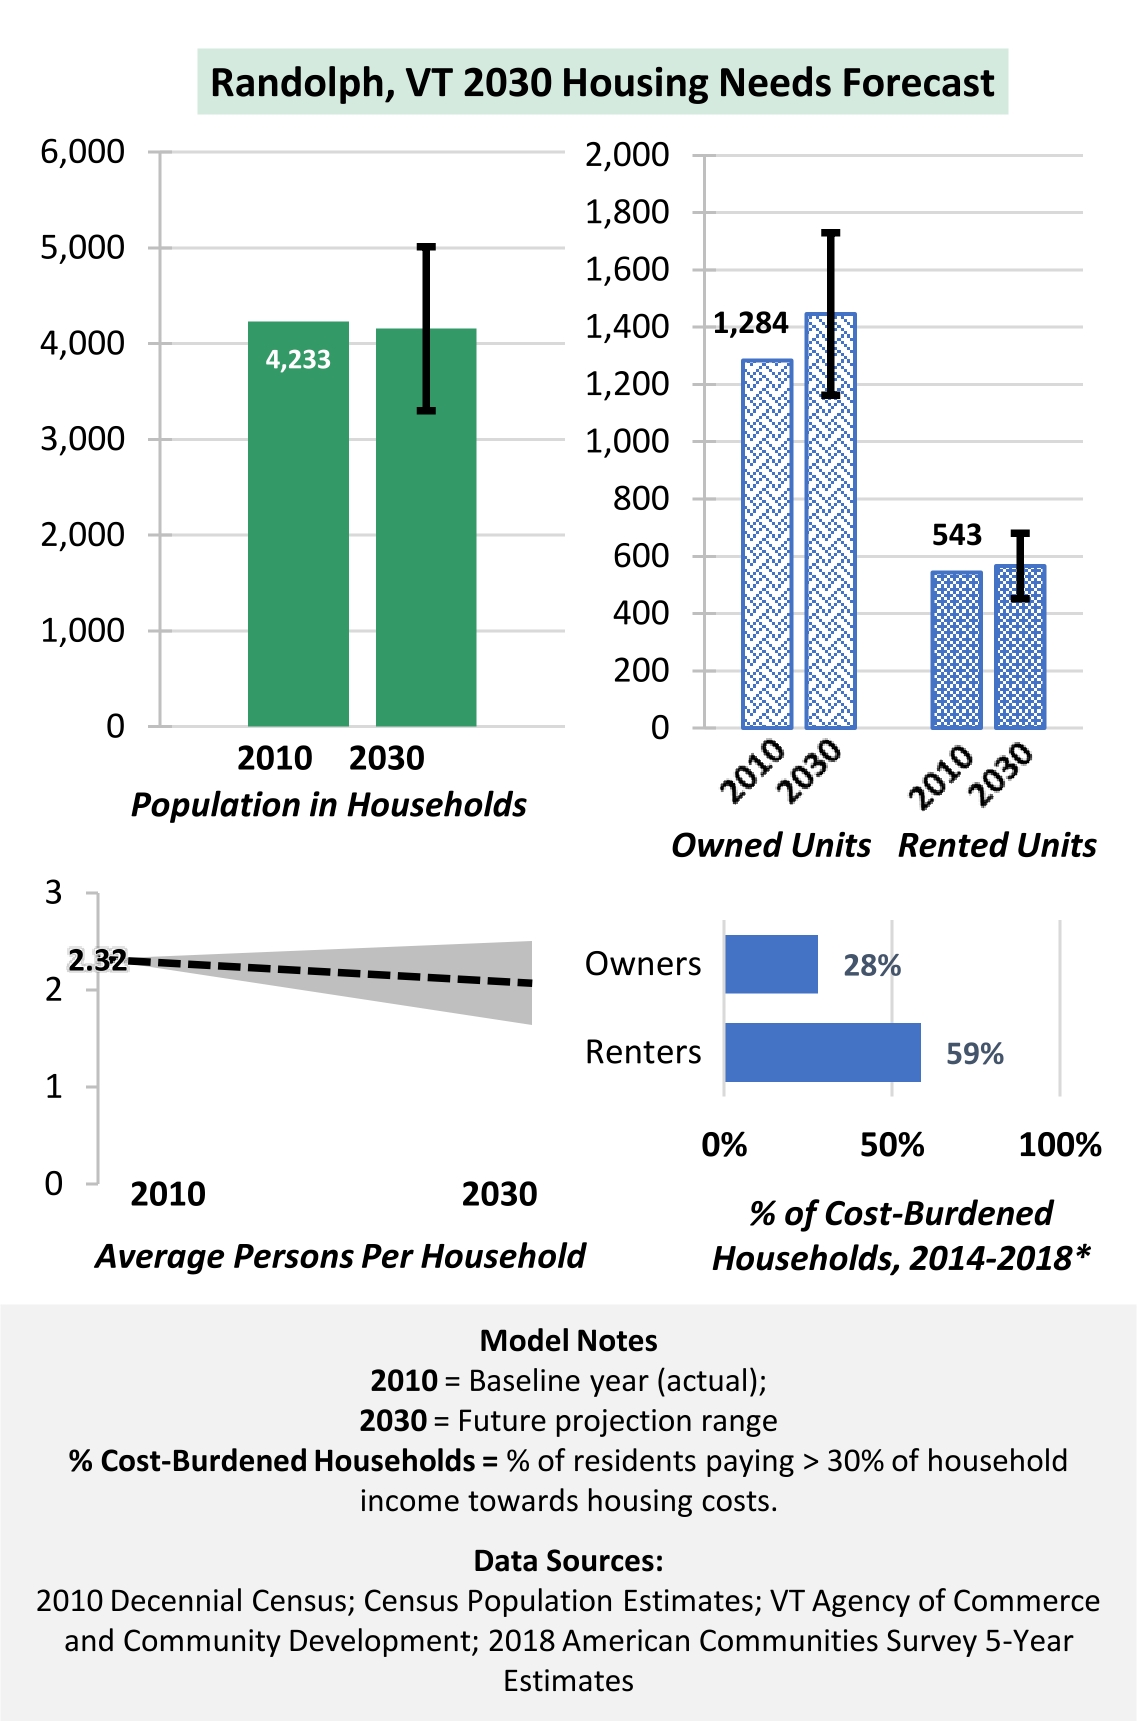
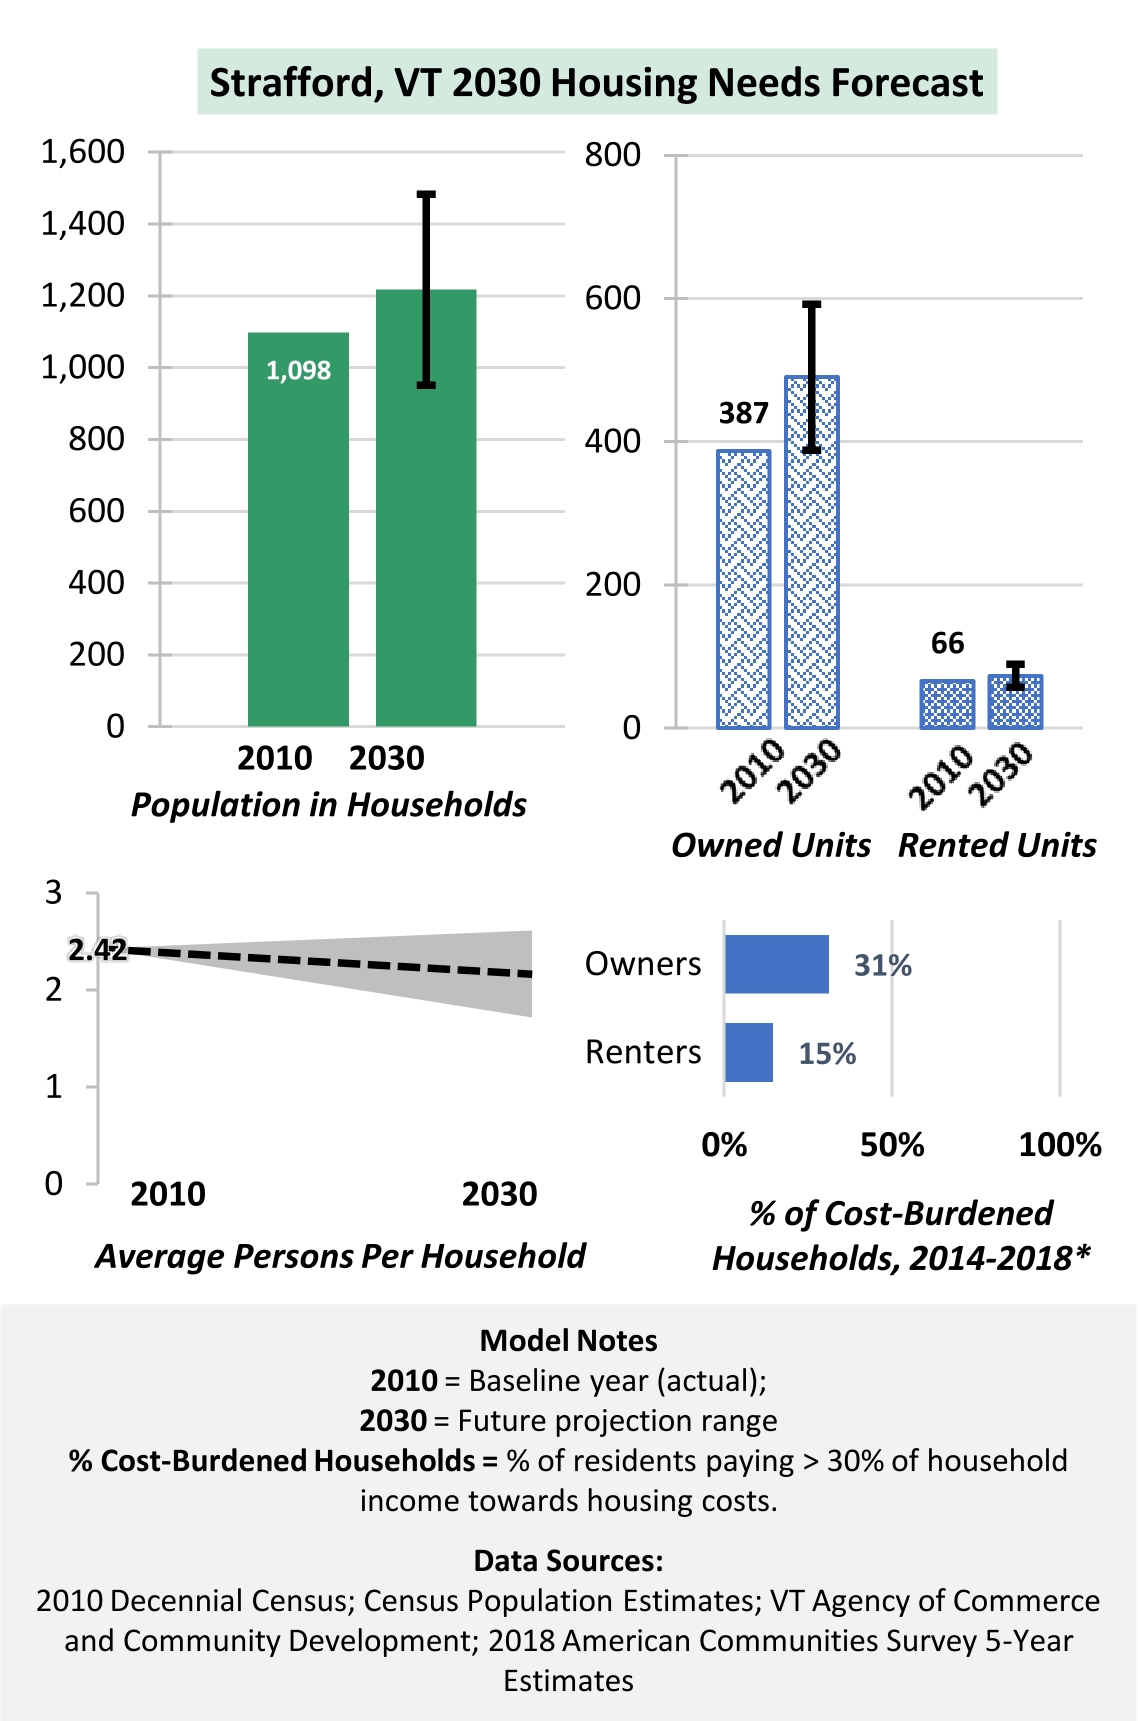
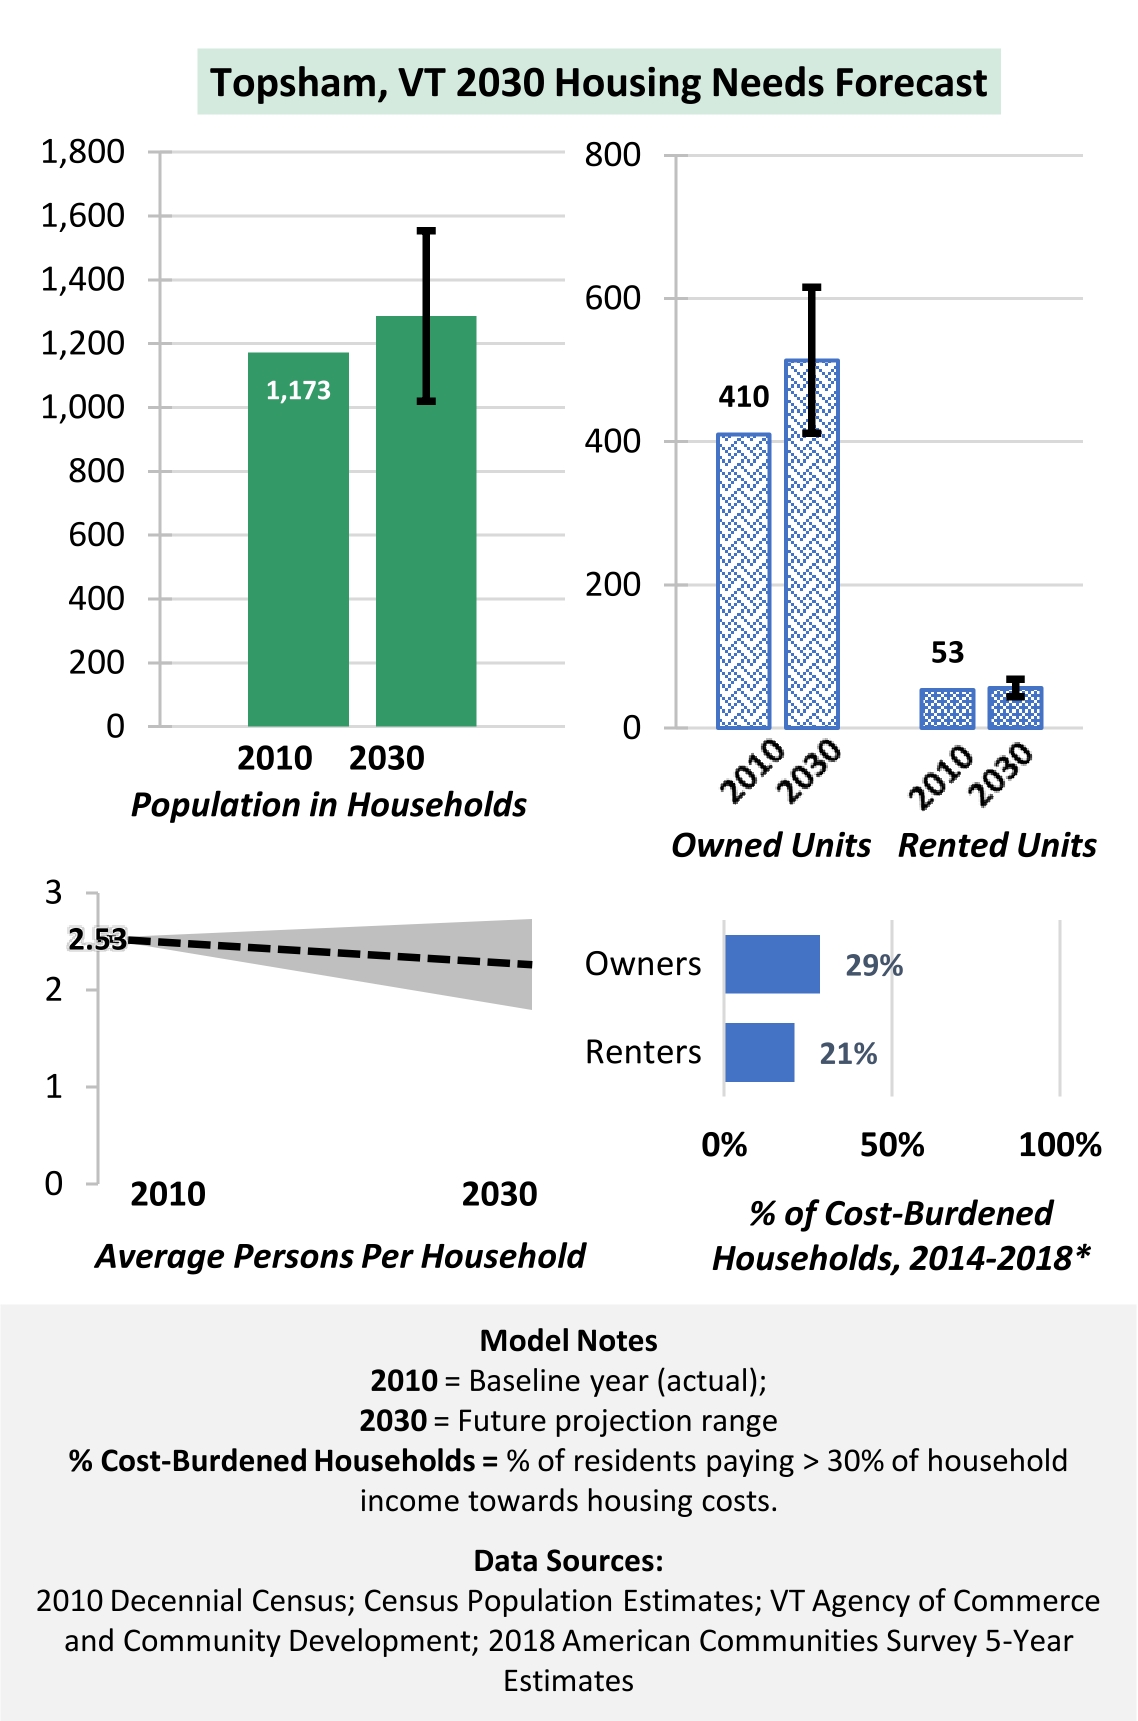
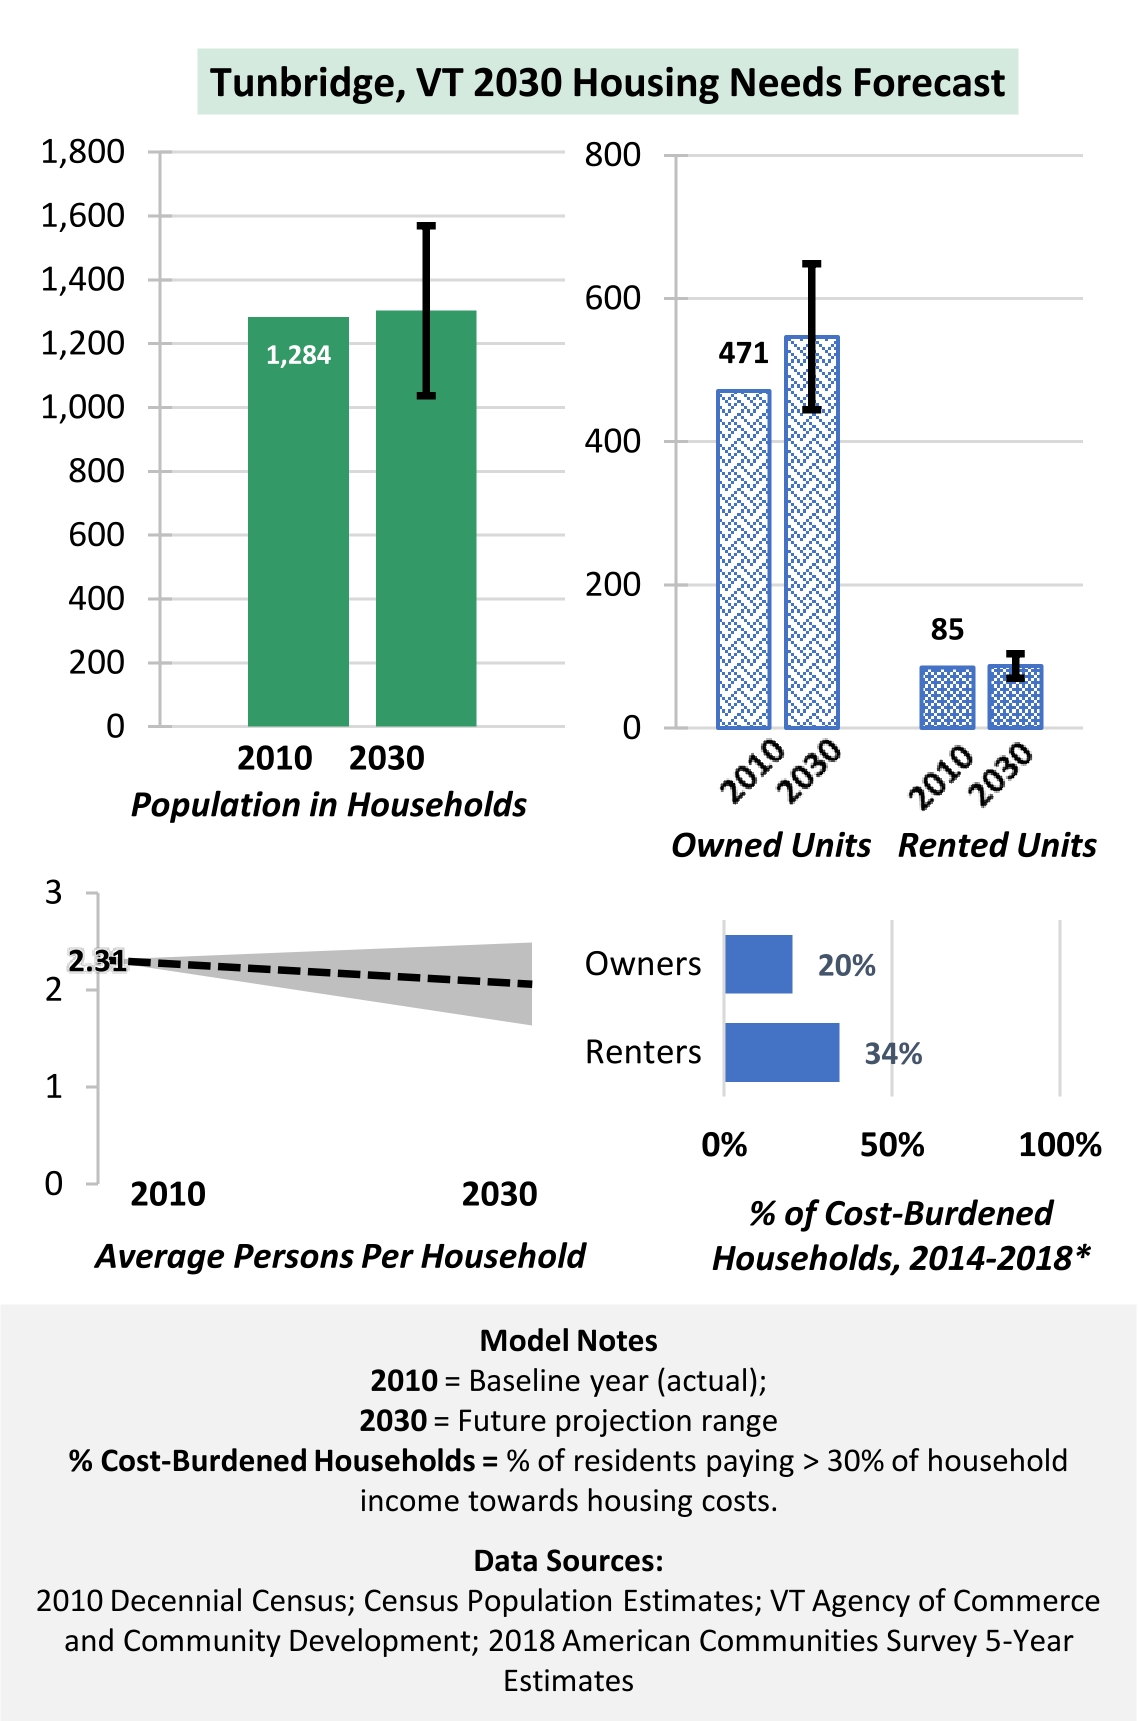
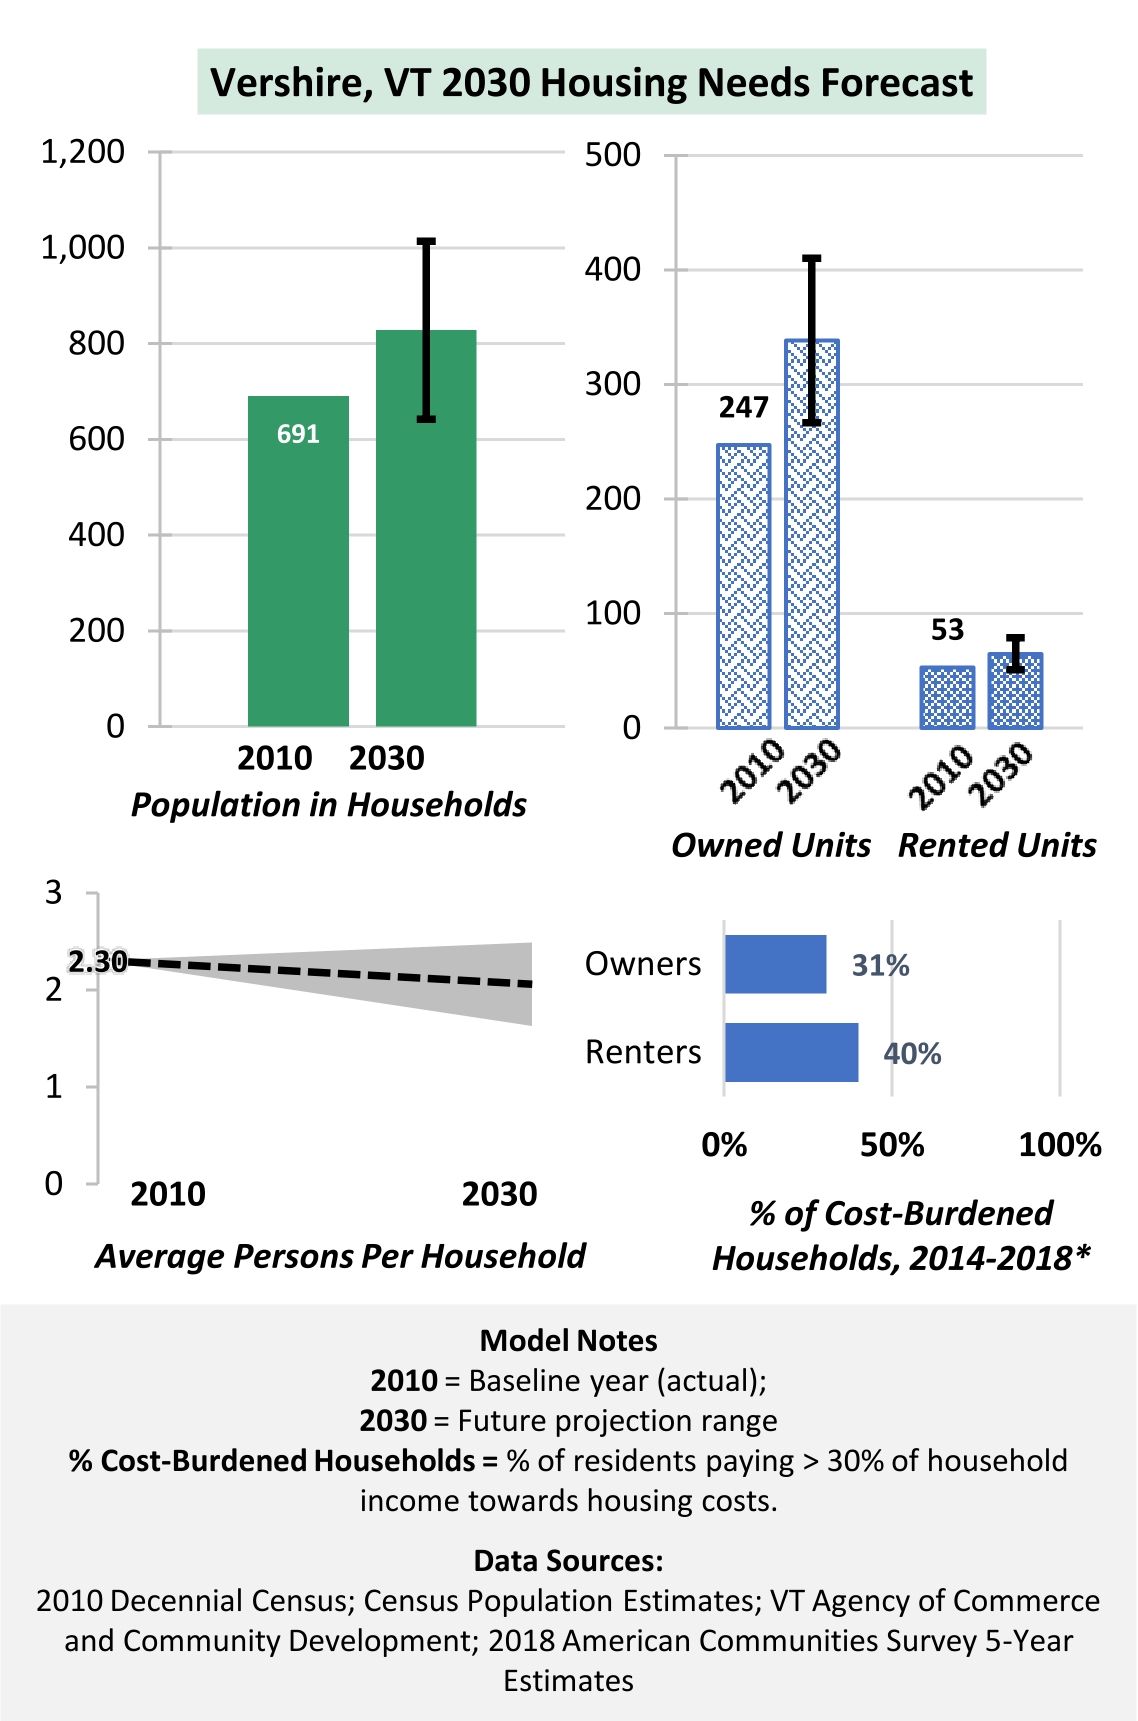
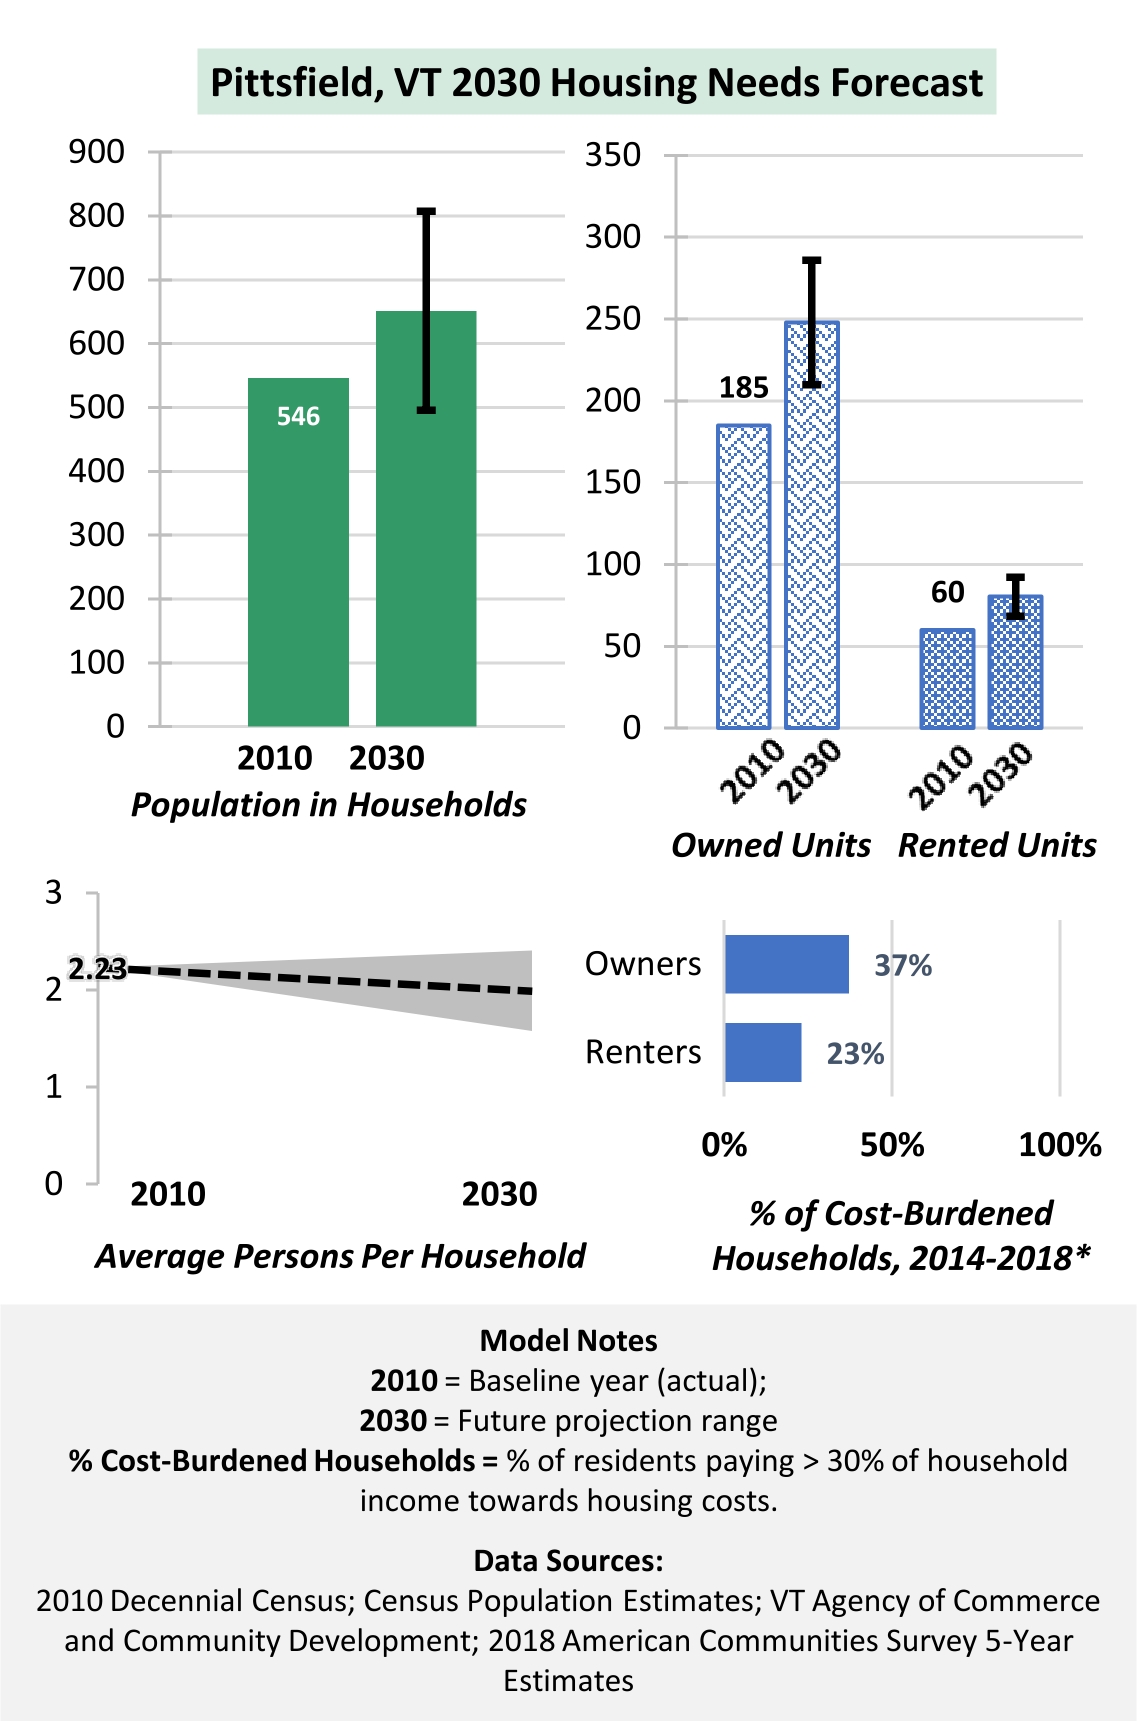
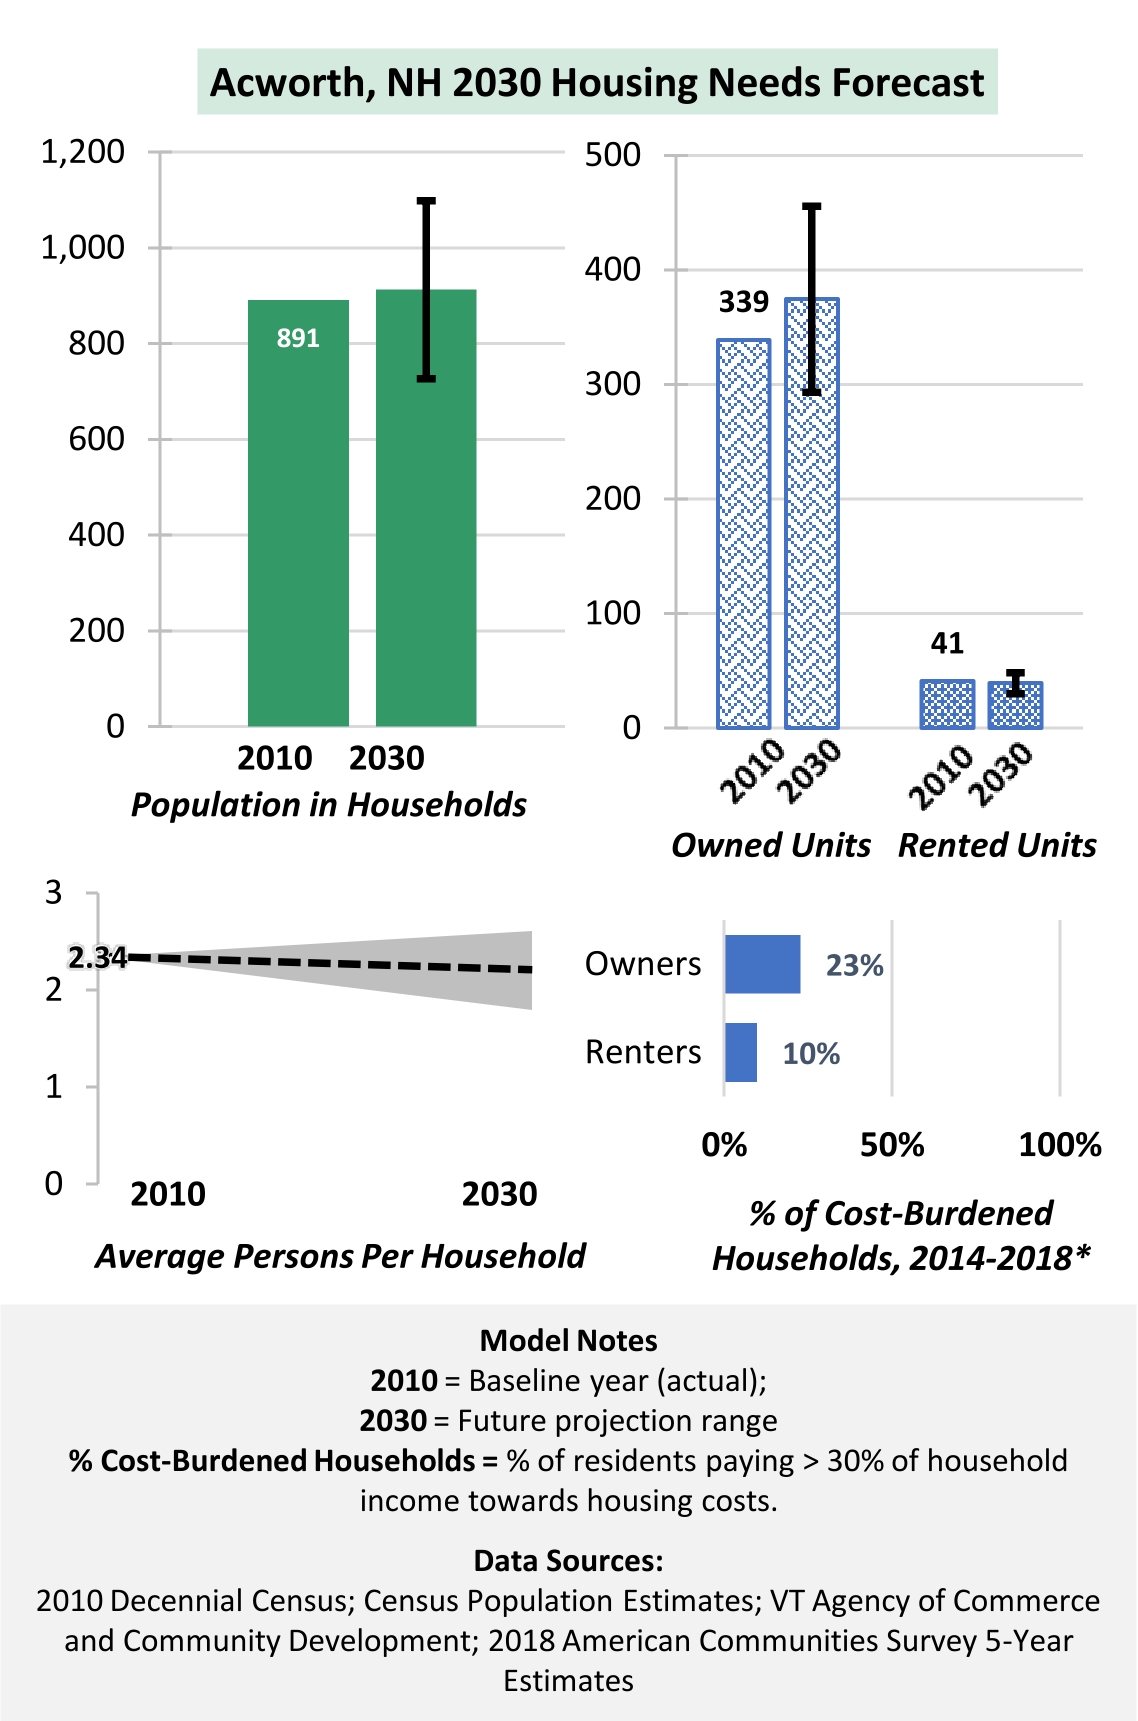
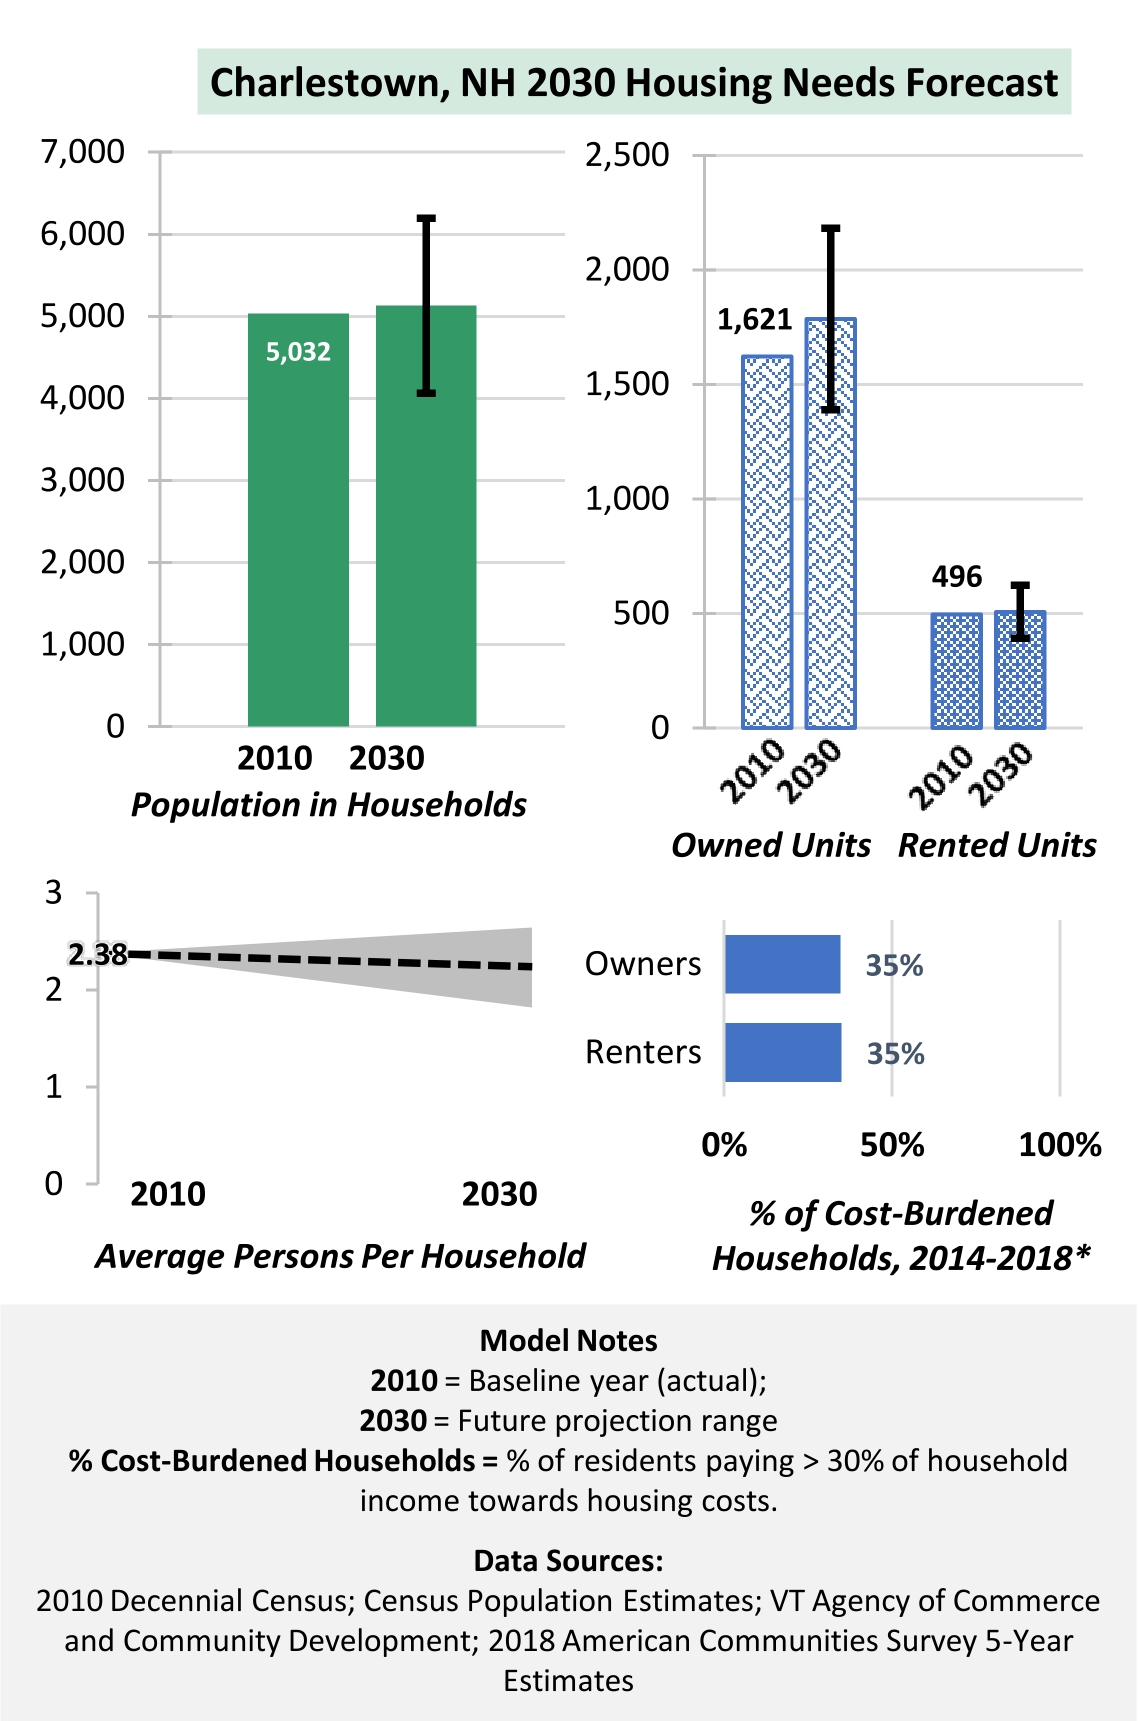
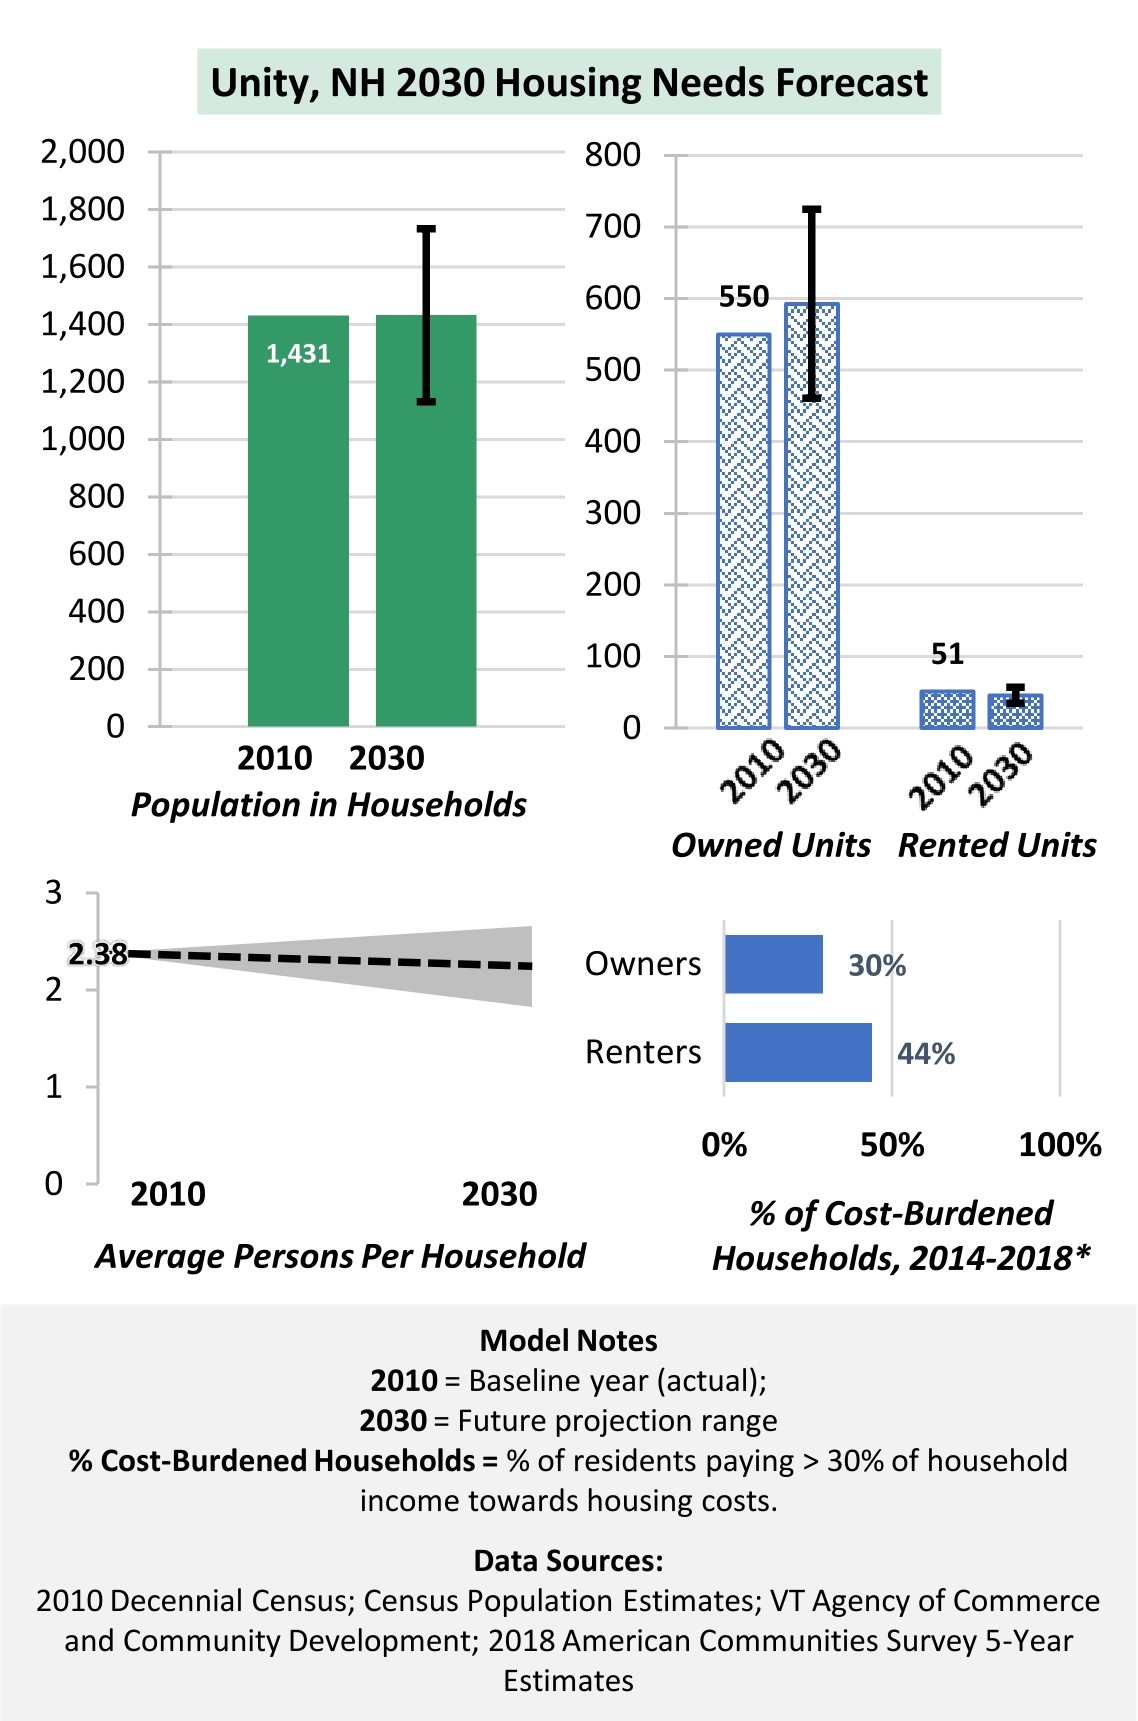
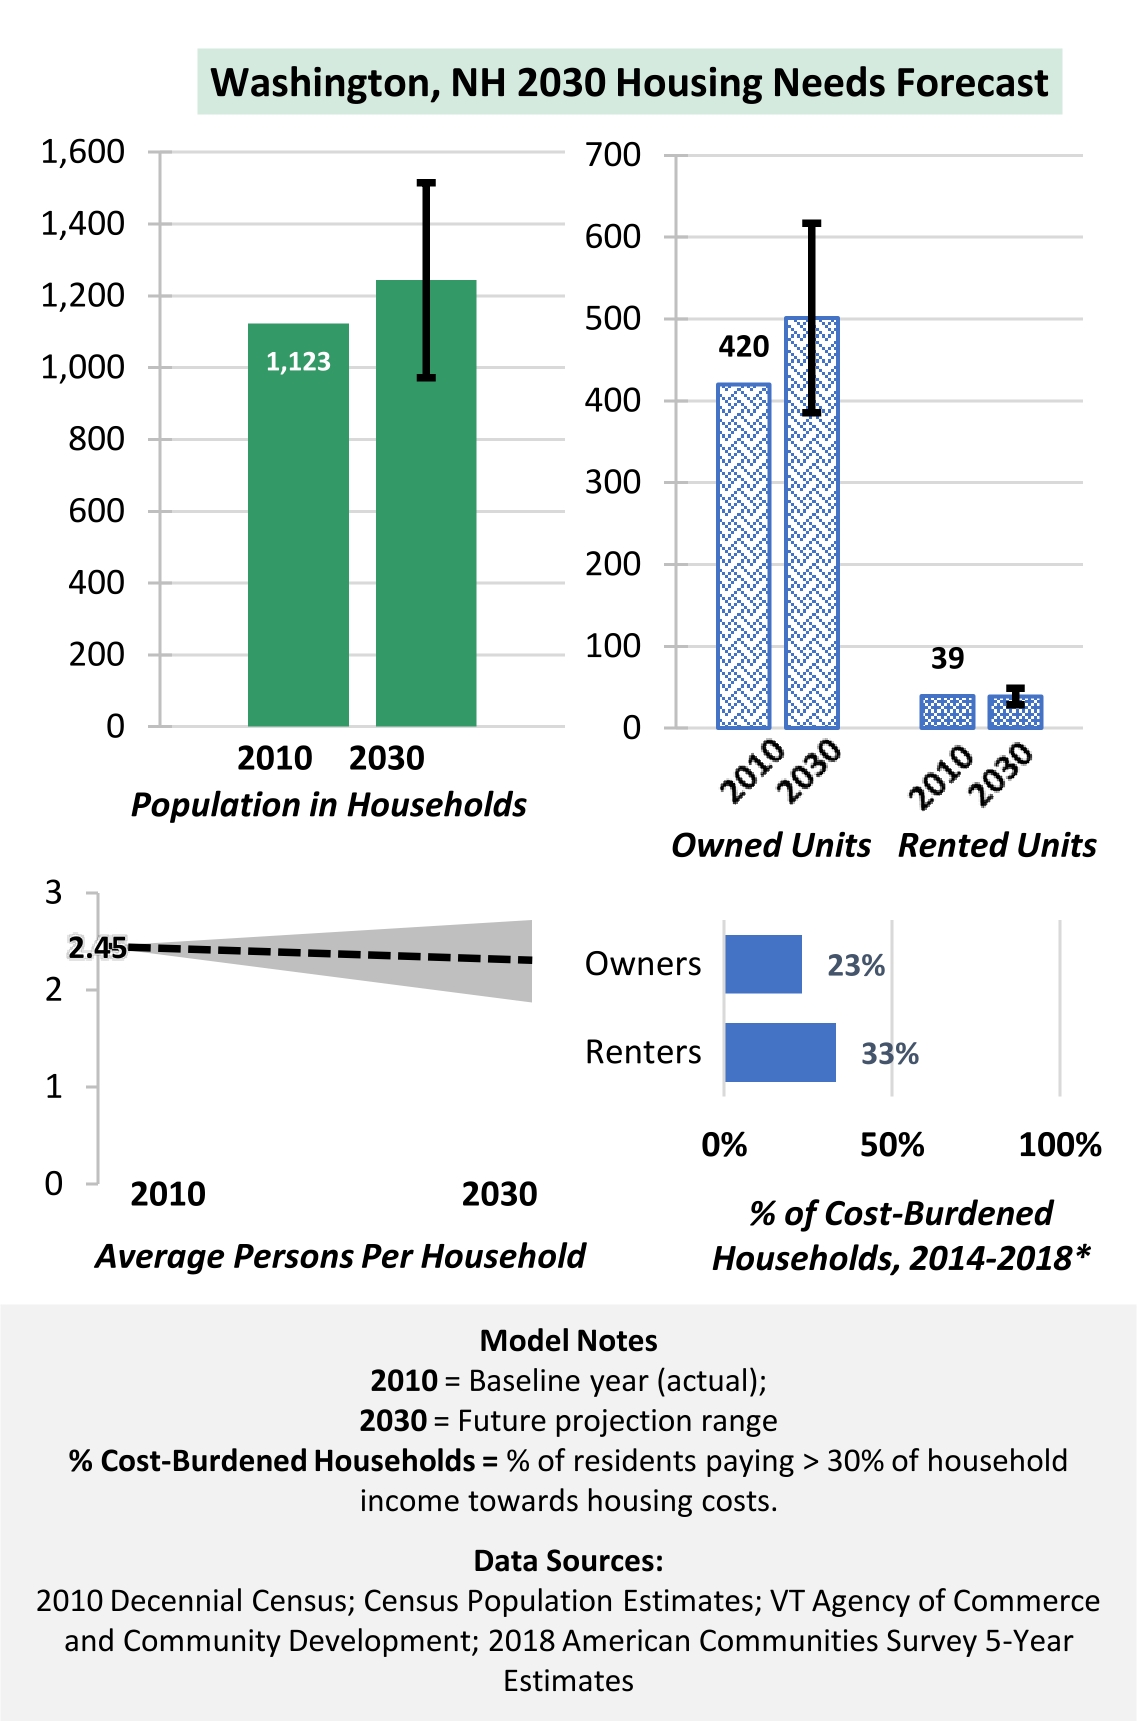
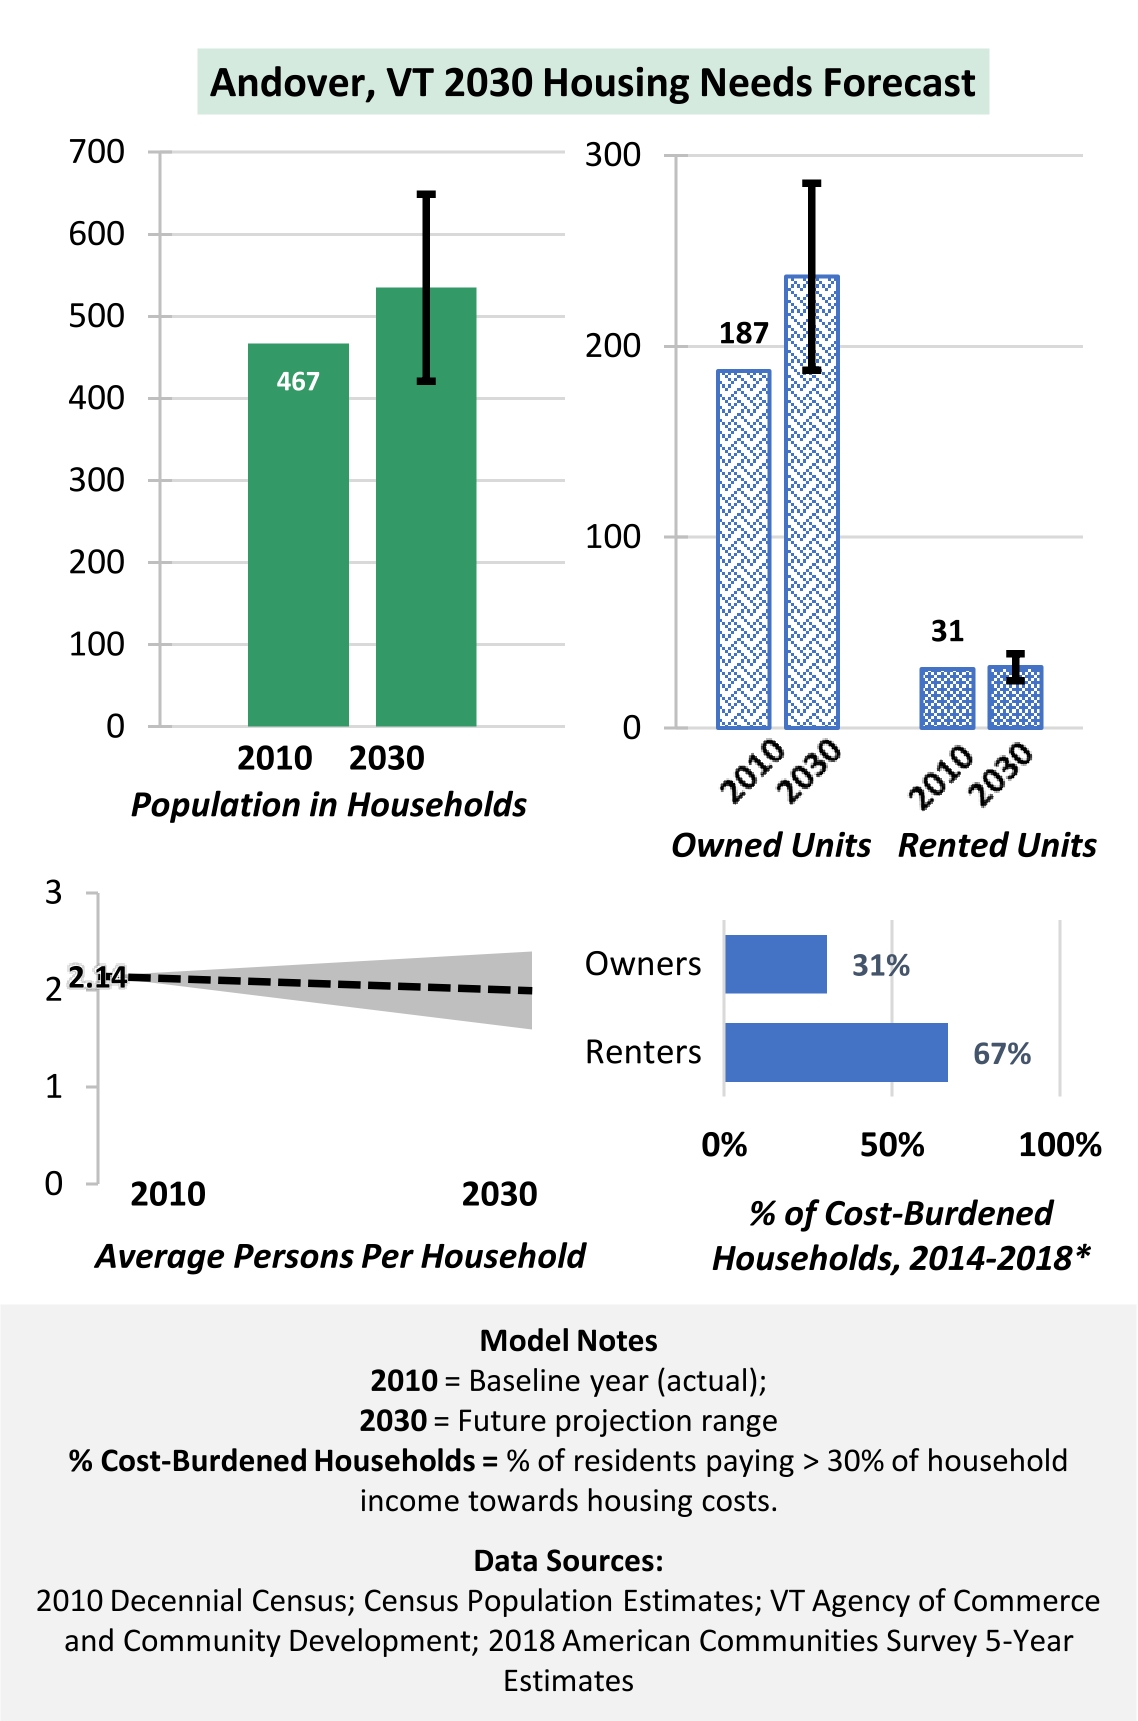
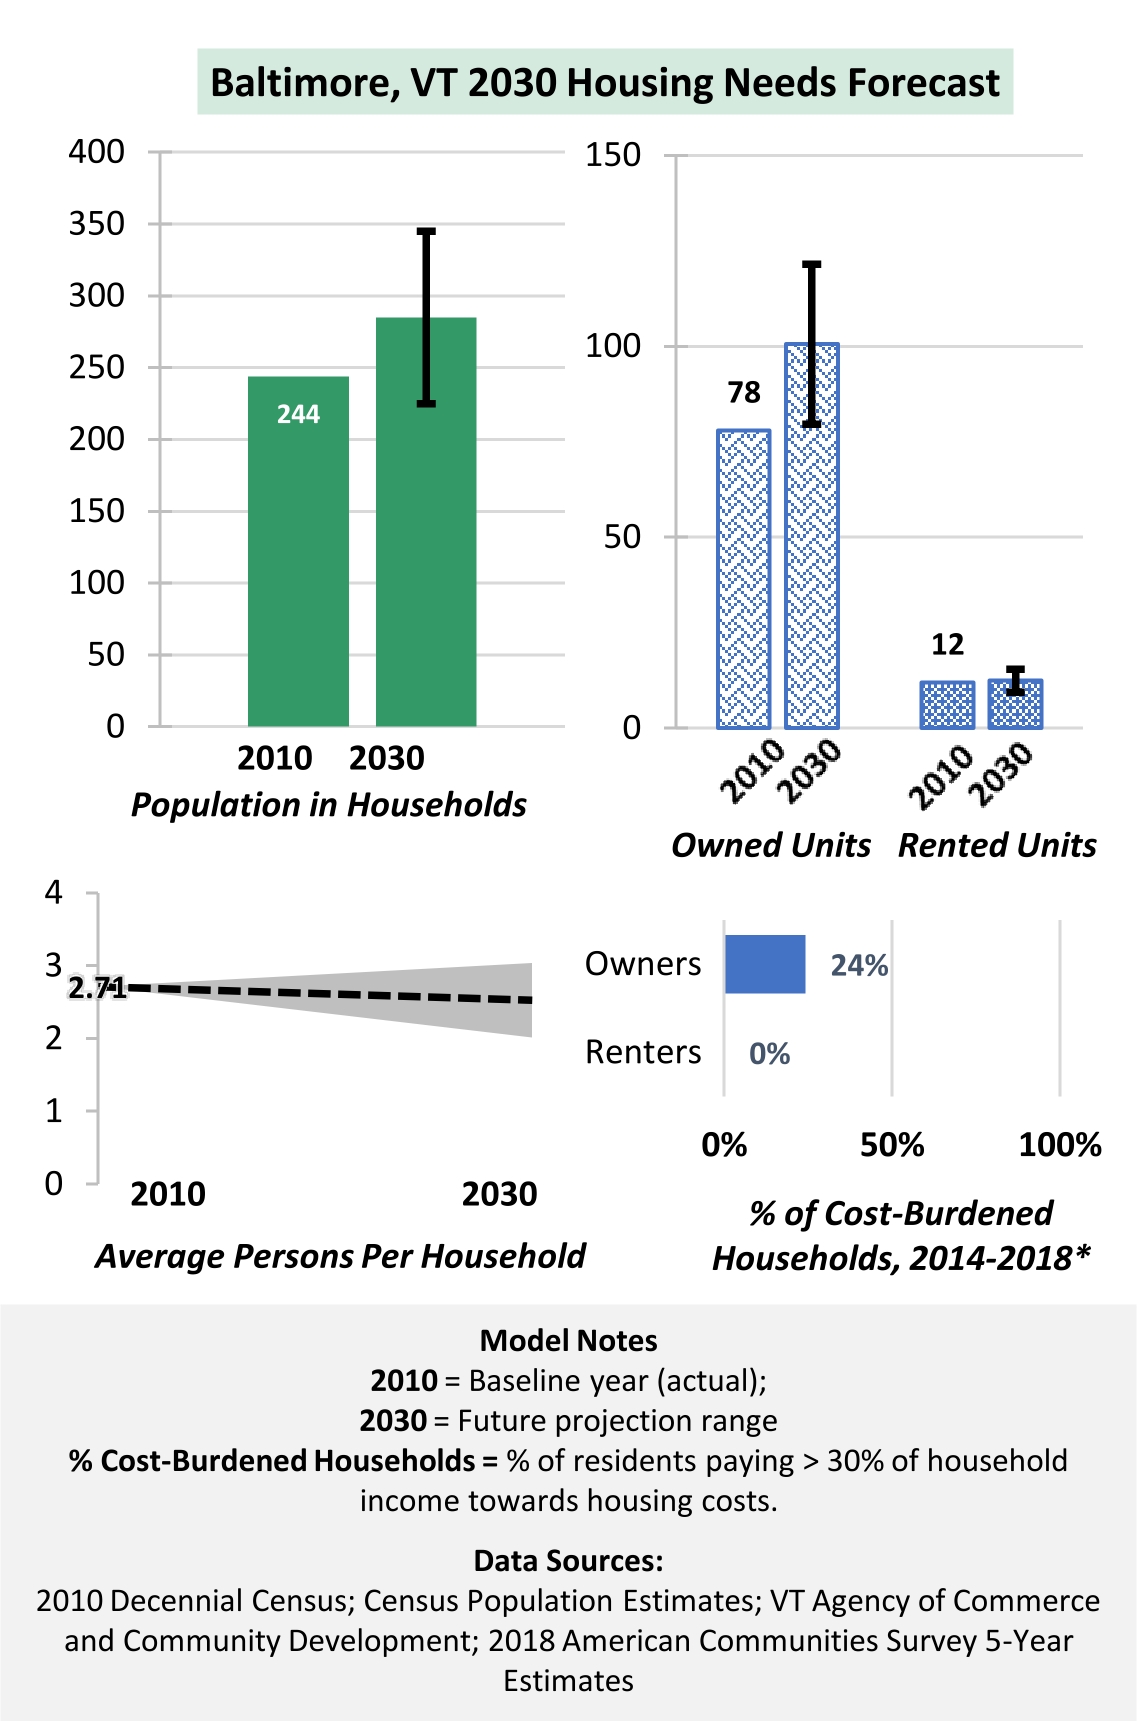
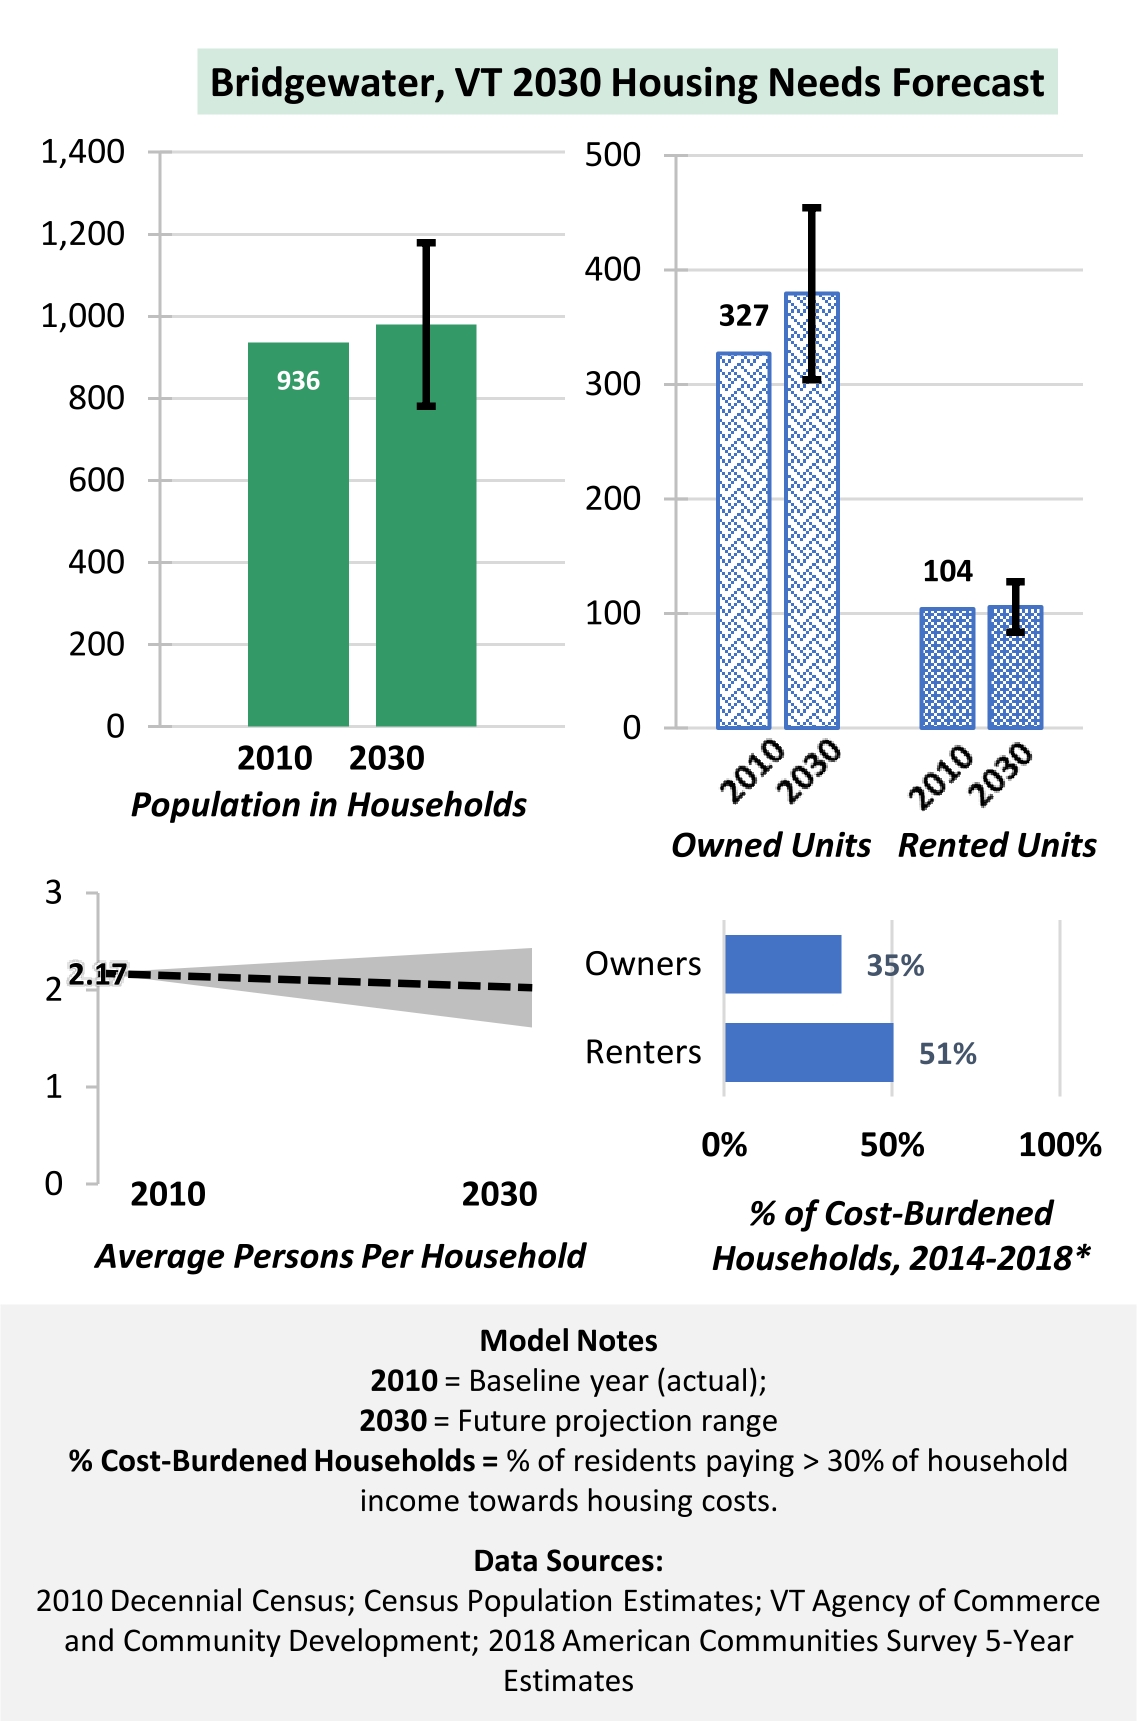
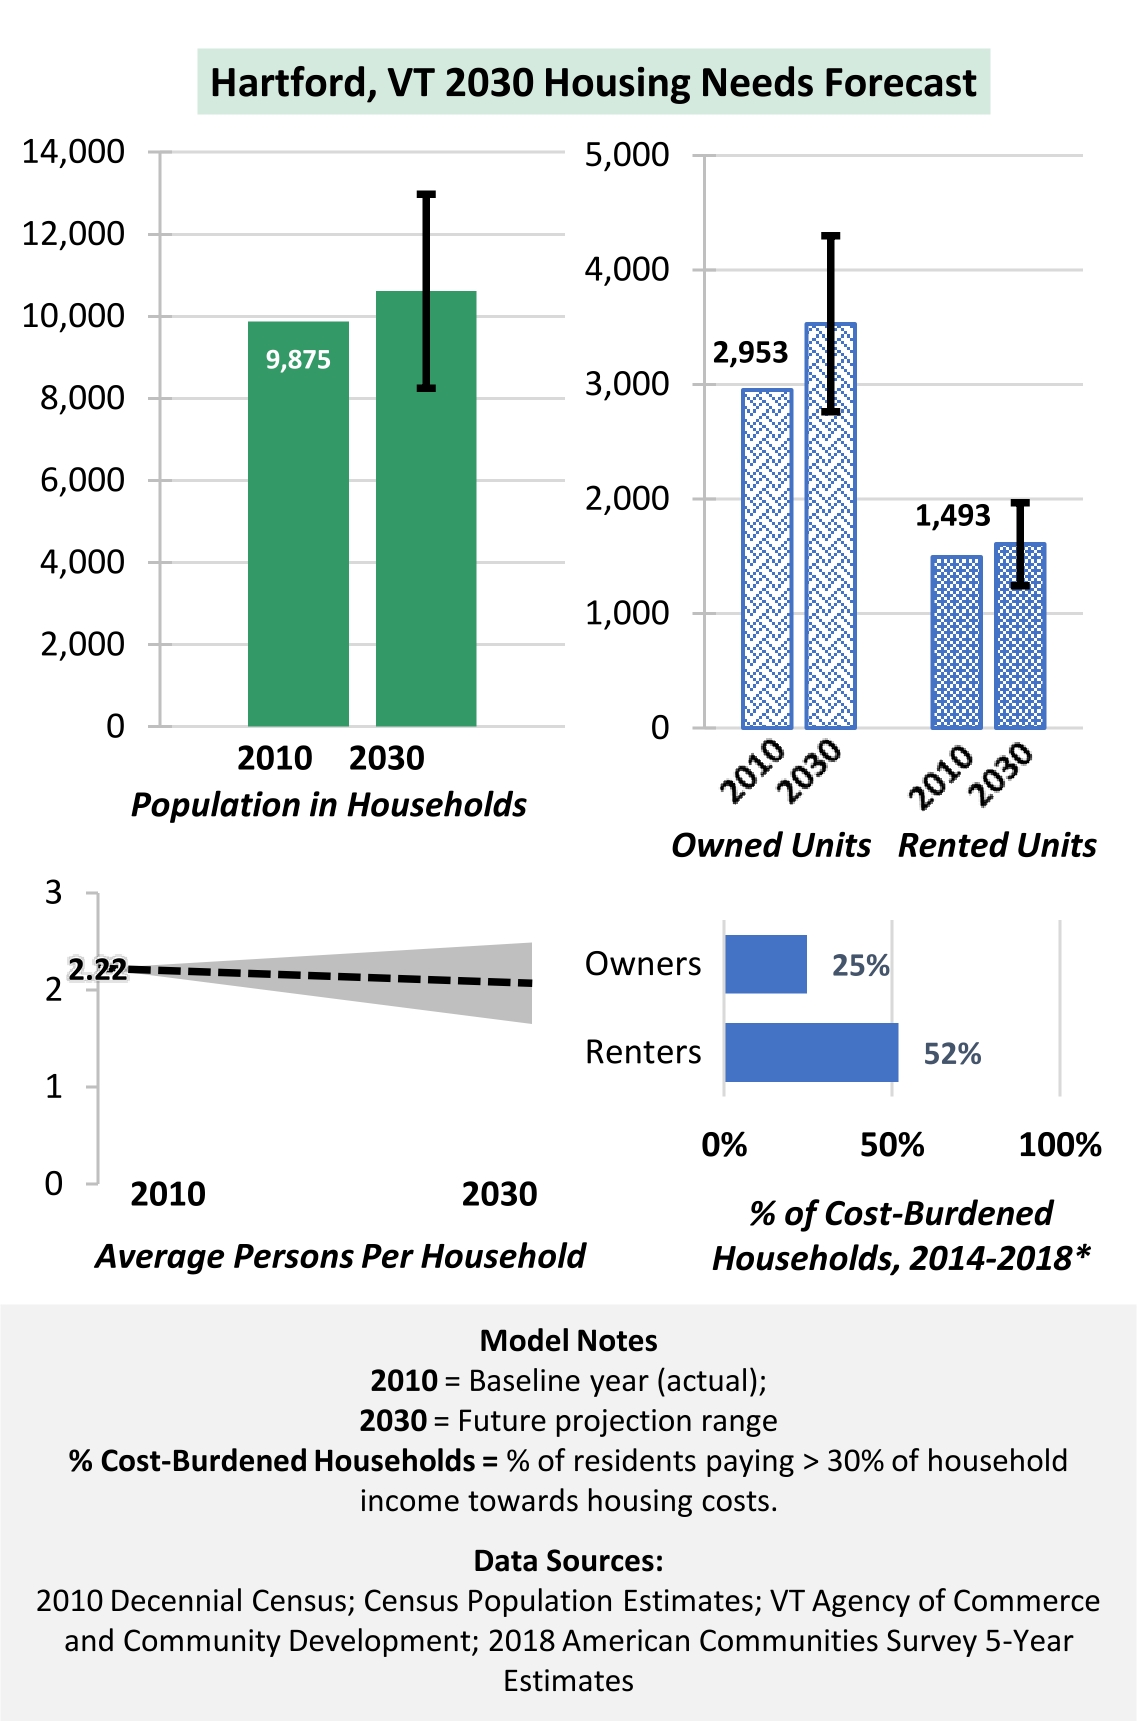
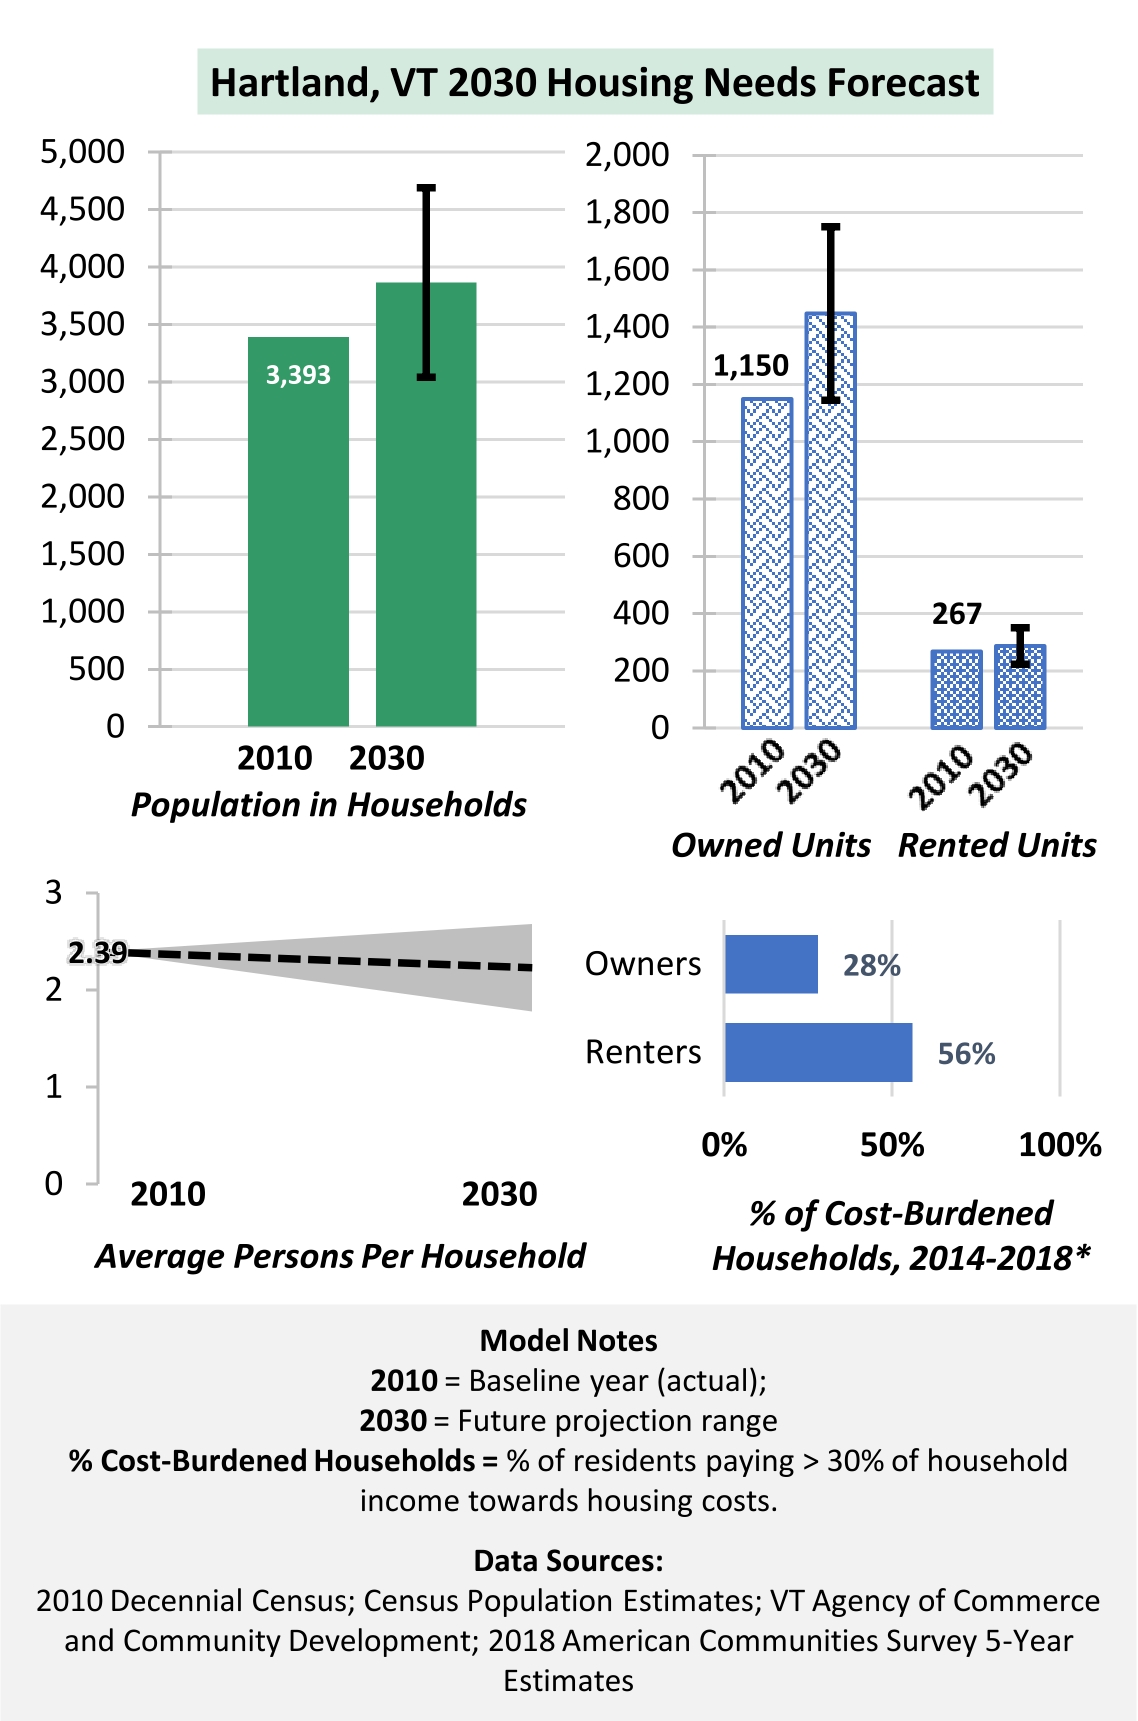
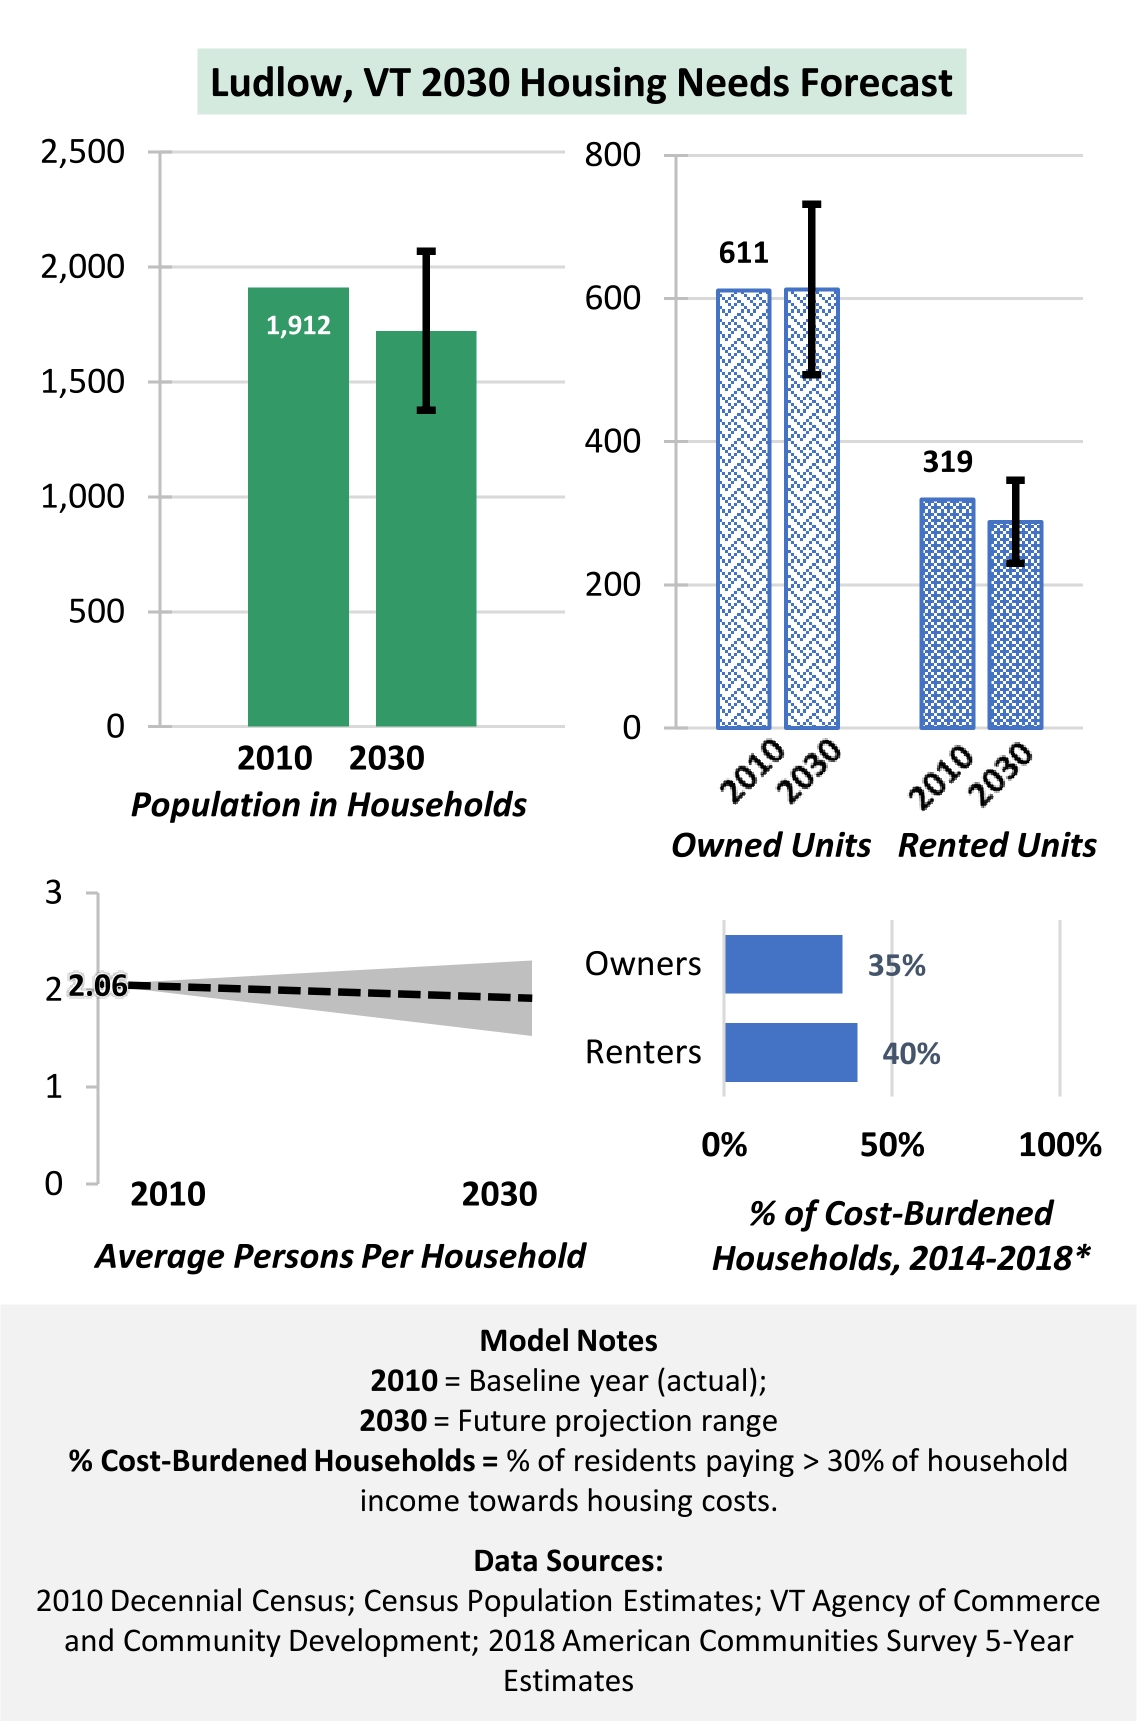
2030 Housing Needs Forecasts


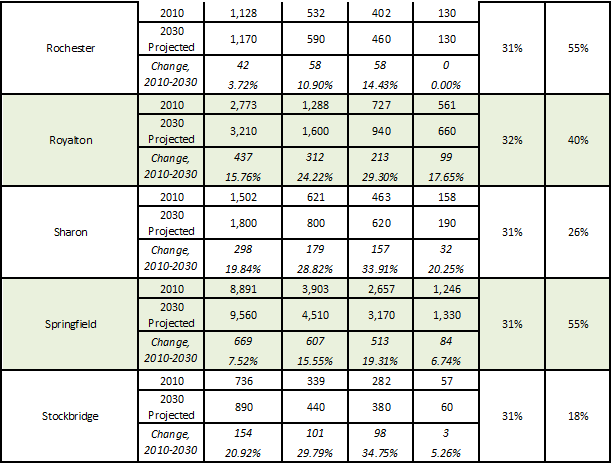
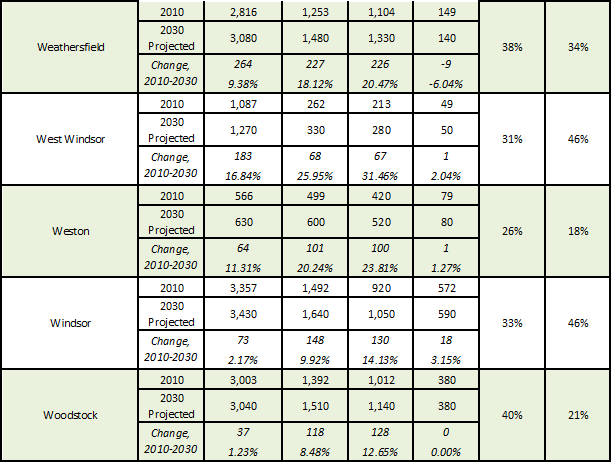
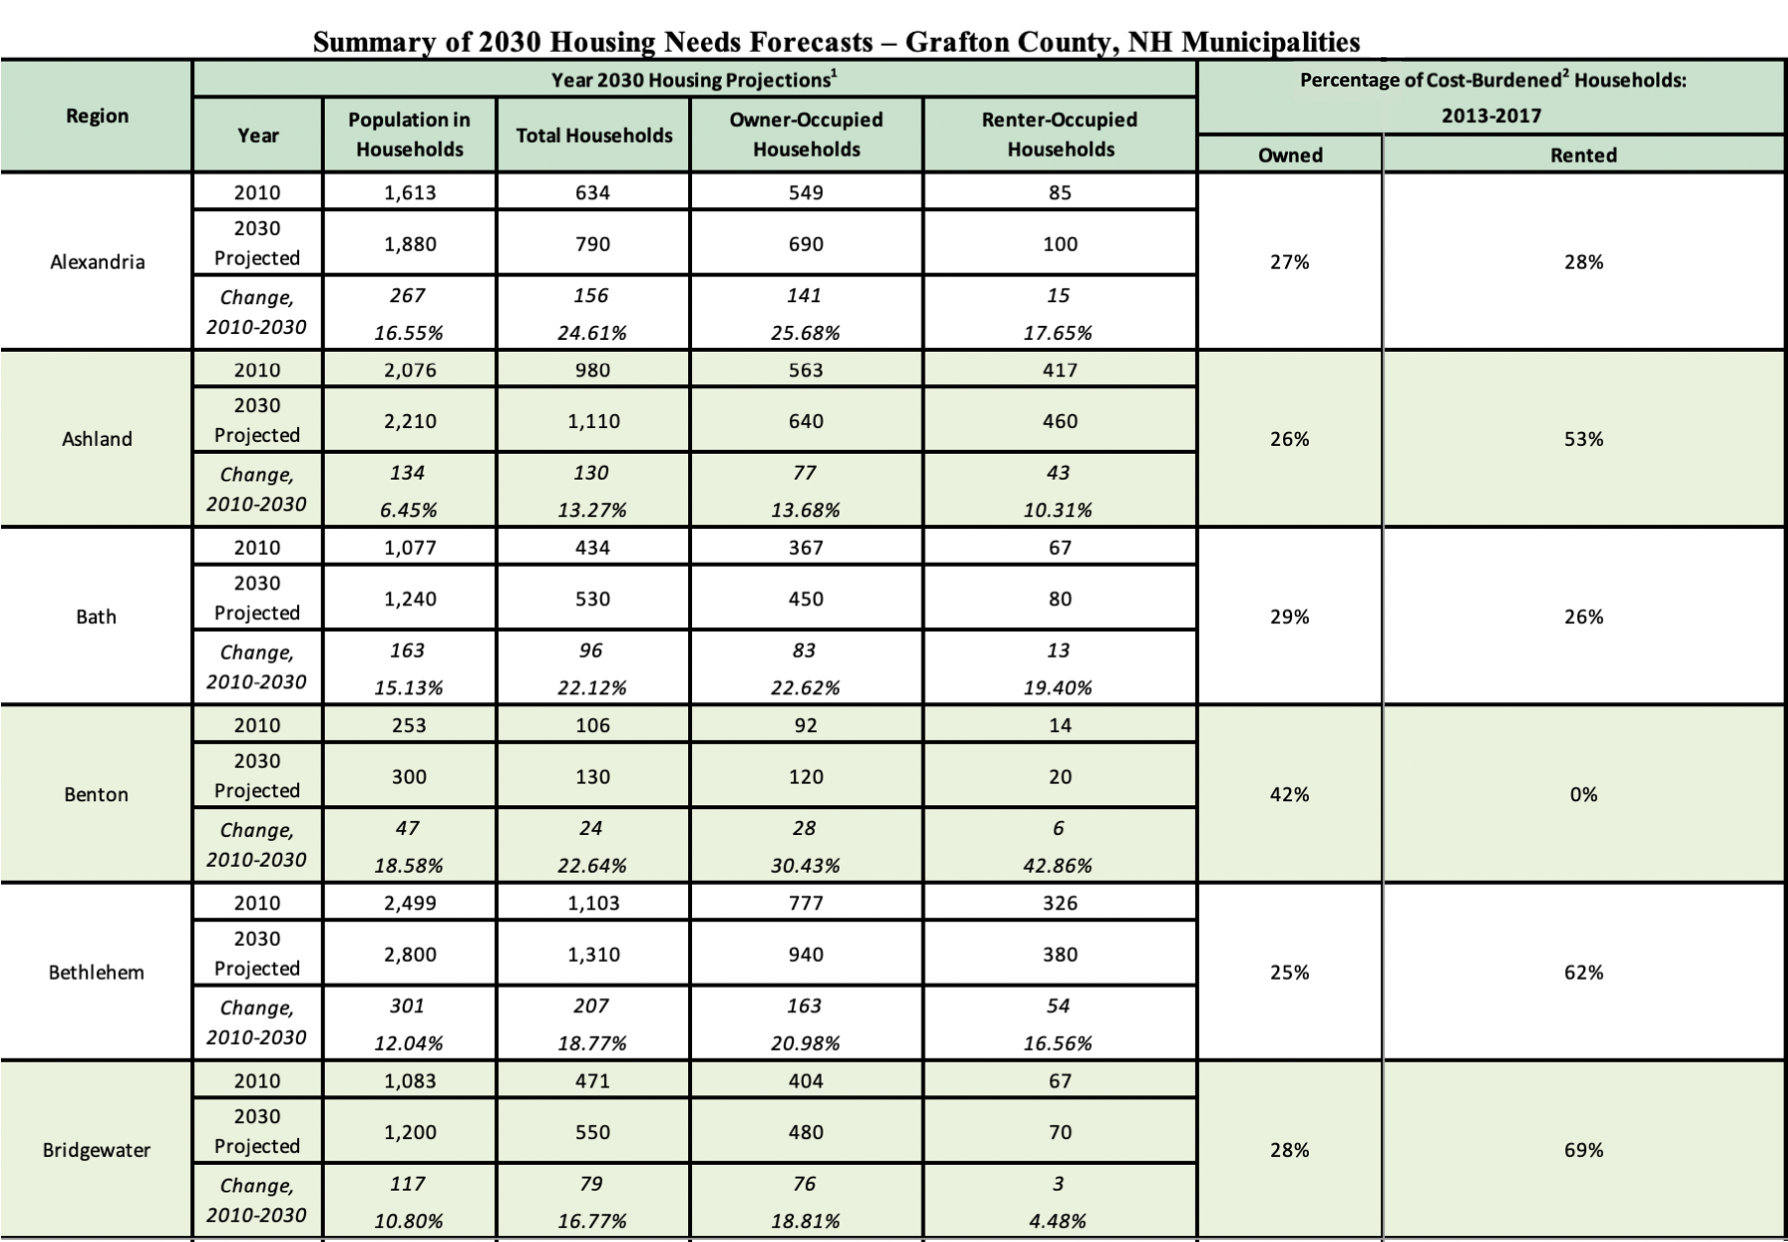
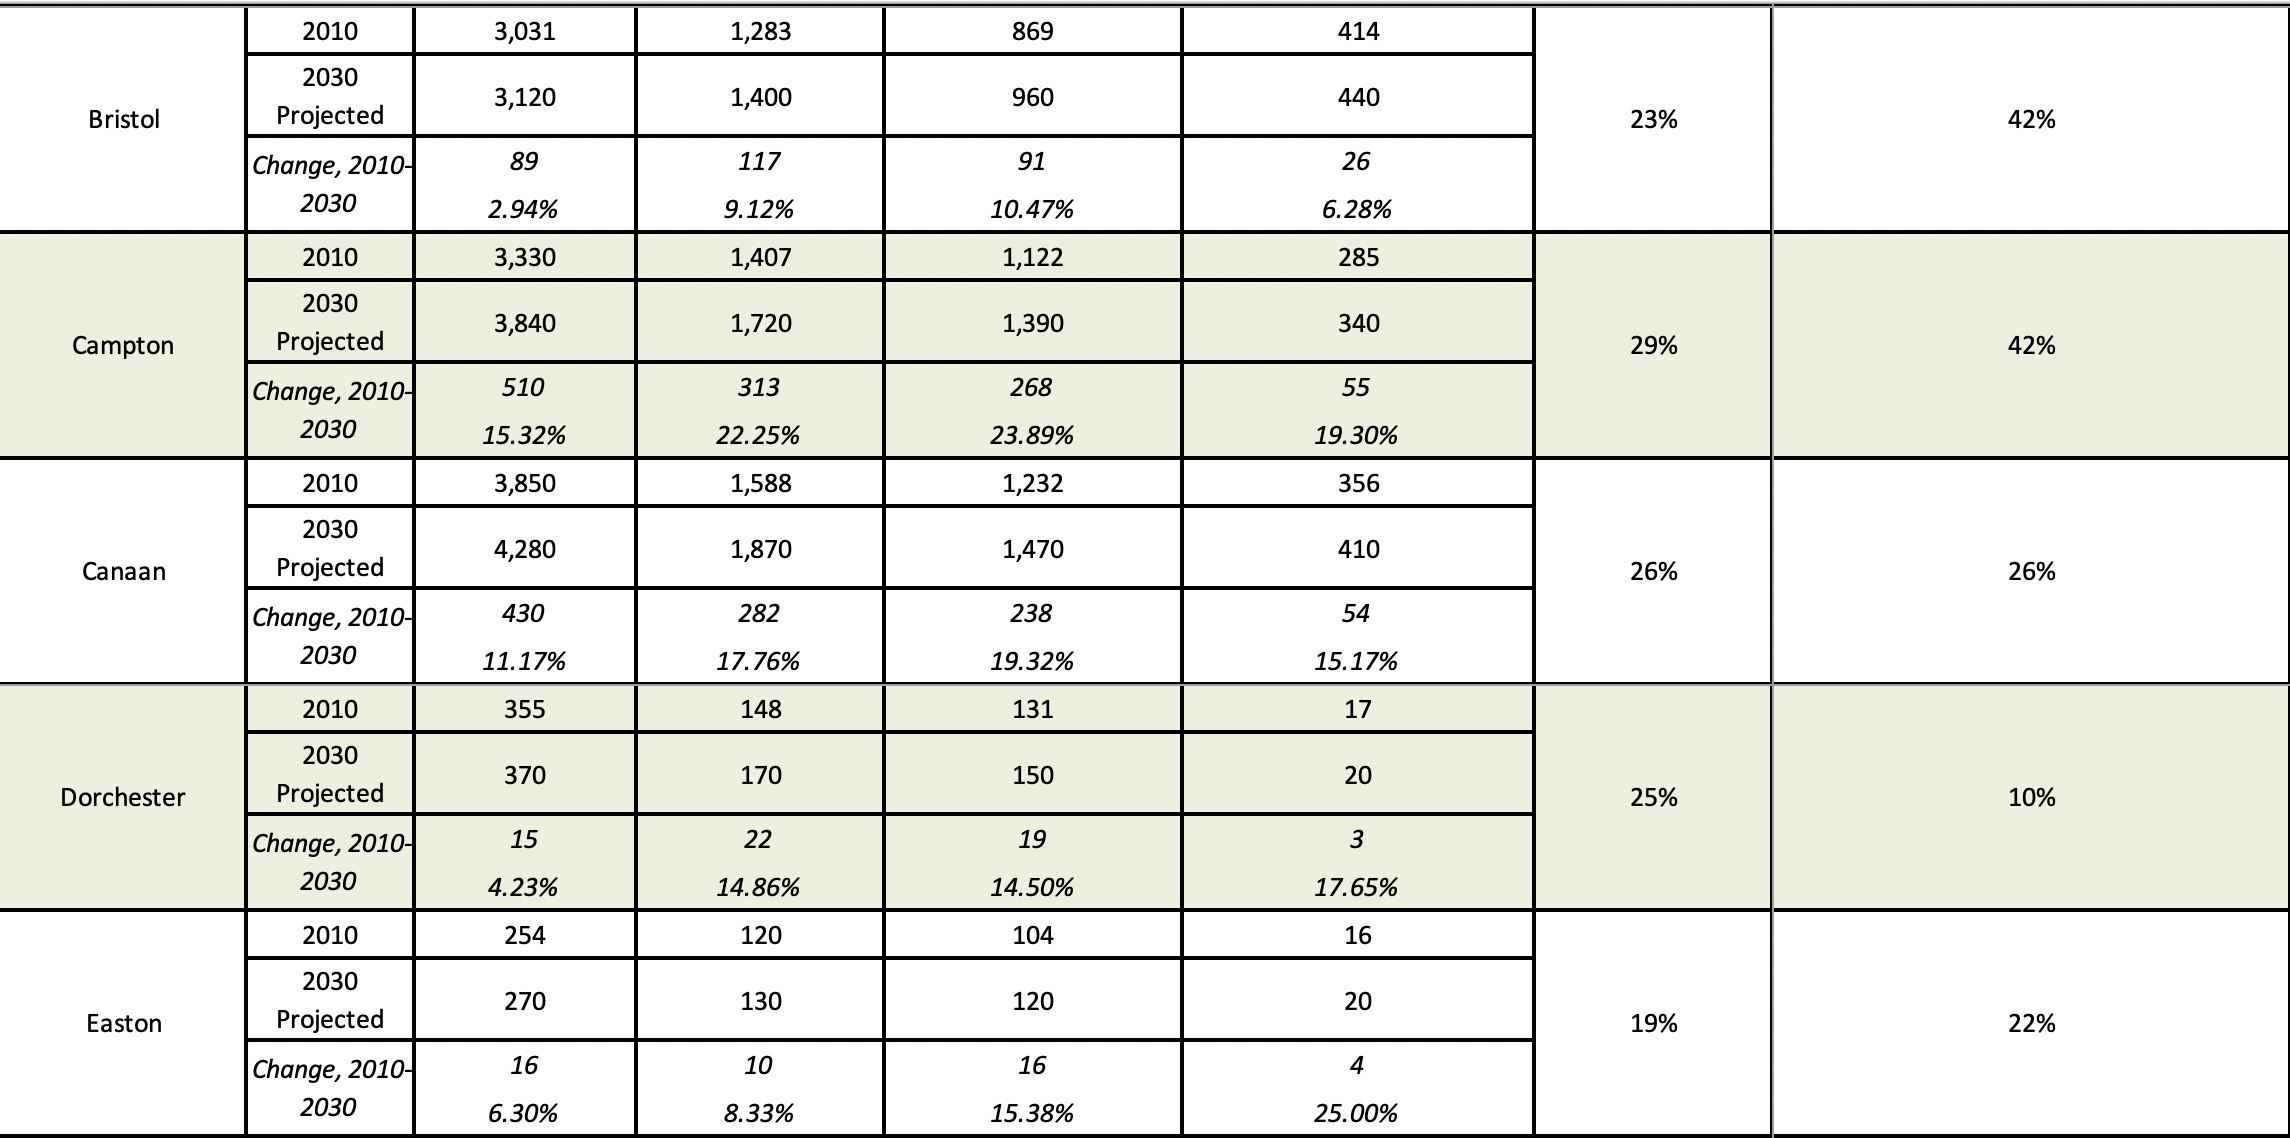


Projections for Each Municipality
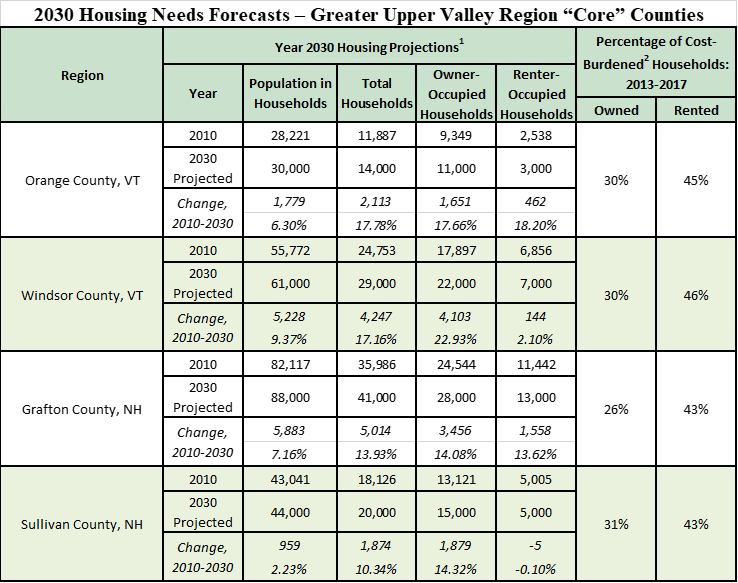
Grafton County, NH
Click on the relevant town to view and download the 2030 Housing Needs Projections
Merrimack County, NH
Click on the relevant town to view and download the 2030 Housing Needs Projections
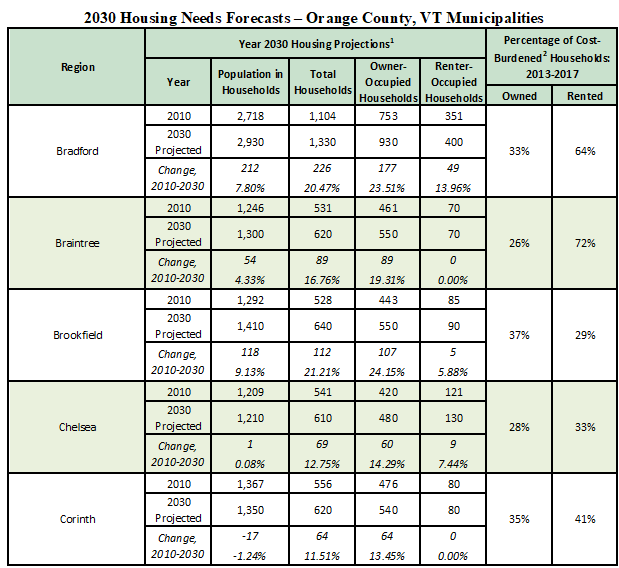
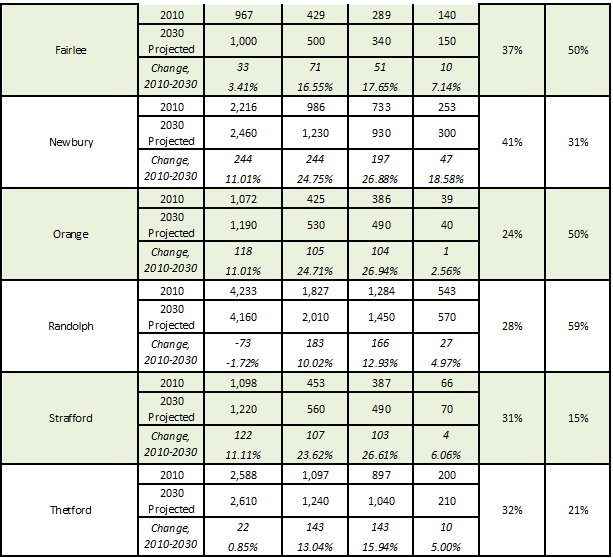
Orange County, VT
Click on the relevant town to view and download the 2030 Housing Needs Projections
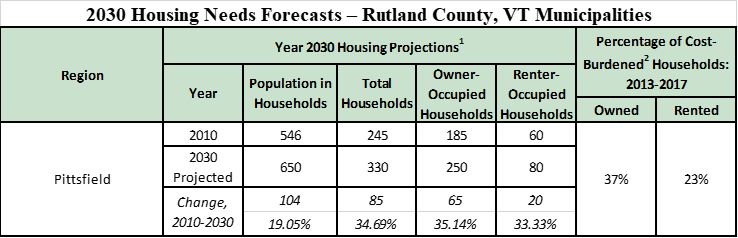
Rutland County, VT
Click on the relevant town to view and download the 2030 Housing Needs Projections
Sullivan County, NH
Click on the relevant town to view and download the 2030 Housing Needs Projections
Windsor County, VT
Click on the relevant town to view and download the 2030 Housing Needs Projections
Methodology
Methodology
With any modeling effort, it is important to keep in mind both the goals and limitations. A common saying in the field of statistics is that “all models are wrong, but some are useful.” This forecast does not attempt to produce specific estimates of population and housing units – the goal is to apply and extrapolate general demographic trends to anticipate future housing needs. Many factors can influence population sizes and housing options, particularly over a ten-year period. For example, the COVID-19 pandemic led to an influx of residents to Vermont and New Hampshire as well as economic challenges for current residents – such an event cannot be predicted using a simple model.
The methodology for the housing needs forecast can be summarized as follows:
- Use the NH Center for Public Policy headship housing forecast model.
- Use 2010 Census population and housing units as baseline data (can easily be updated with 2020 Census).
- Use State of NH1 and State of VT2 year 2030 population projections (completed in 2016 and 2013, respectively), to power the model.
“Headship” is defined as the number of households in a community or region divided by the adult population3. Headship can be a useful indicator of housing supply and costs – a lower headship ratio indicates more adults per household, which suggests that more adults are living together, potentially in response to housing costs or limited supply. Headship is also responsive to aging populations – older households tend to be smaller, so a larger percentage of older residents will lead to an increased headship ratio.
The NH Center for Public Policy housing needs model first looks at headship within each age cohort (e.g., age 25-34) in the base year, then looks at projected changes in age cohorts (i.e., how many more/less 25-34 year-olds will there be in 2030) to estimate future changes in overall headship in the community or region. This information is used to turn population projections into projections of housing demand and average persons per household.
This modeling process incorporates several assumptions:
- The headship ratio of a particular age cohort will remain constant between 2010 and 2030.
- In order to make the model work for municipal-level projections, it was assumed that overall headship in municipalities would change proportionally with changes in county headship. This is because the NH Center of Public Policy model was designed for county-level projections, and 2010 Census data for age cohort populations is only available at the county level.
- Based on a literature review and consultation with Tri-Commission staff, it was assumed that all municipal projections will have a margin of error of +/- 20% and all county-level projections will have a margin of error of +/- 15%.
Additional tweaks to the model were made to improve the accuracy of the forecast:
- To assess the accuracy of populations projections, the projections from the State of NH and State of VT were compared to annual Census Population Estimates4. This exercise was used to create two sets of population projection inputs for the model: 1) using the State of VT and NH population projections as-is; and 2) using the percent difference between the projected population and Census Population Estimate to adjust projection populations. Two sets of forecast results were generated using this method in order to better estimate a range of possible outcomes. This range is represented in the result charts presented in this memo.
- To assess changes in households since the 2010 Census (the base year for analysis), comparisons were performed with 2014-2018 American Community Survey (ACS) data. Overall, there was little change in the number of households during this time, indicating that projections using the 2010 Census as a base year are suitable for this modeling exercise. As noted earlier, these projections will be updated with 2020 Census data once available.
Footnotes
1 https://www.nh.gov/osi/data-center/population-projections.htm
2 https://dail.vermont.gov/sites/dail/files/documents/vt-population-projections-2010-2030.pdf
3 https://ternercenter.berkeley.edu/blog/new-households