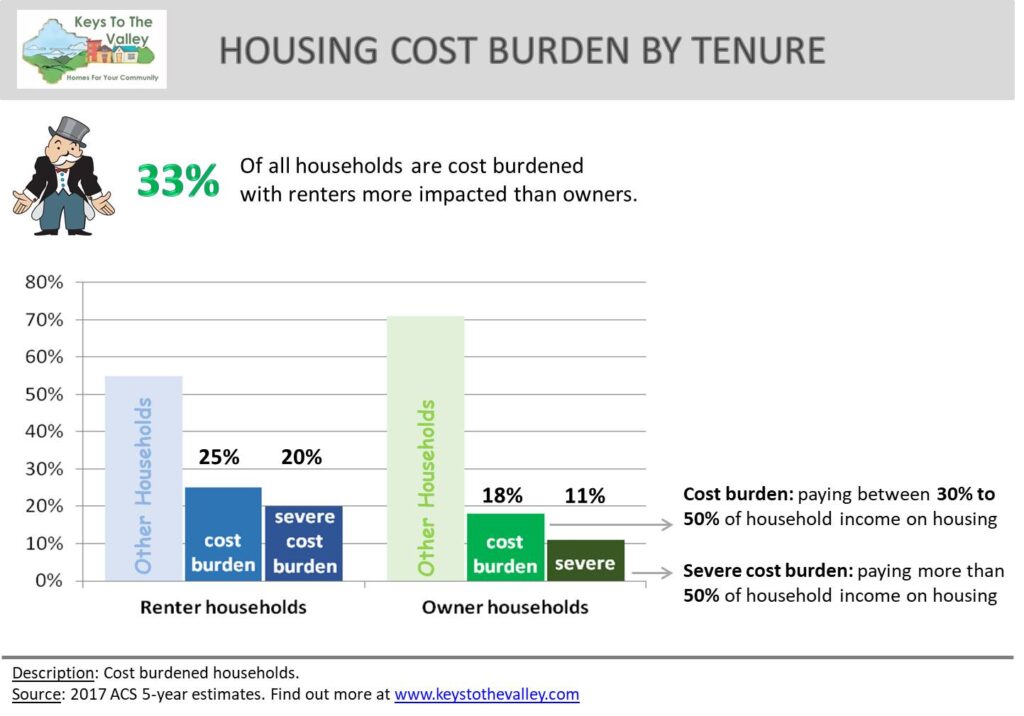
Homes in the greater Upper Valley region (region) are expensive to buy, rent, and maintain. A household is considered “cost-burdened” if more than 30% of household income is spent on taxes, mortgage, utilities, rent, or other housing and maintenance costs. Those who are “severely cost burdened” spend more than 50%. People who spend a higher proportion of their income on their homes have greater difficulty affording other vital expenses including food and transportation. In the region, a third of households are cost-burdened (Figure 10). While renters region-wide are more likely to be cost-burdened, homeowners in our smaller communities also struggle at a higher rate, with nearly a quarter paying 30% or more on housing compared to only 18% of homeowners in larger communities.
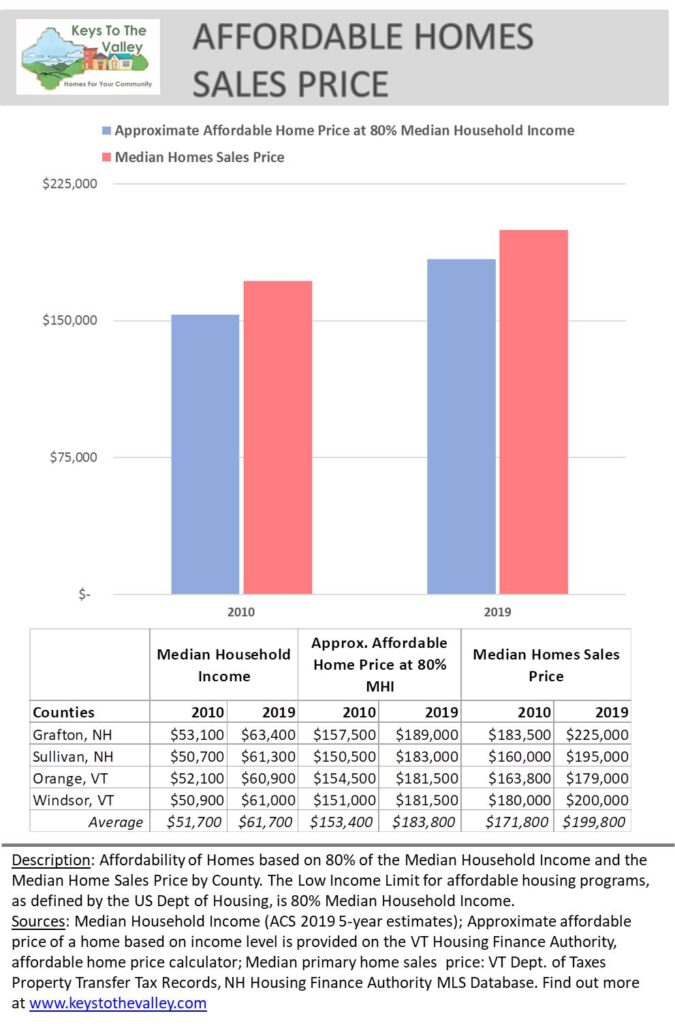
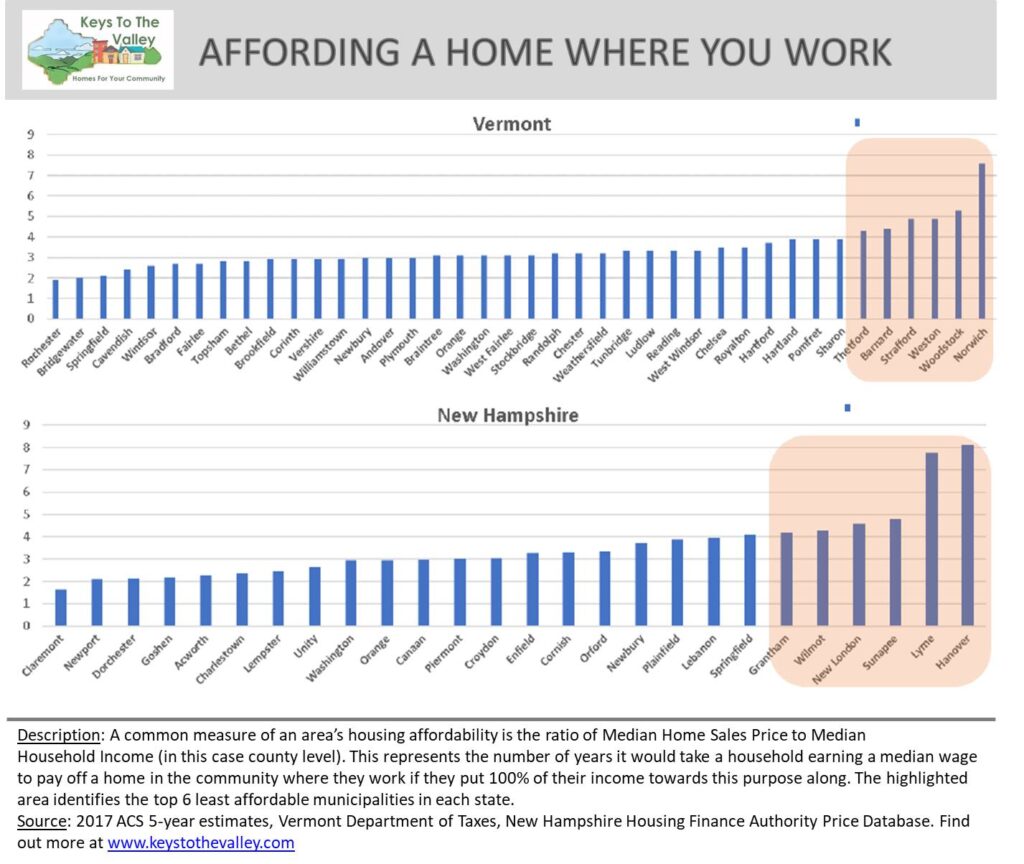
One measure of housing affordability is to compare the median home sales price of an area with an estimated afforable home sales price for low-income households. In 2019, the median home sales price (in this case county-level) is almost 9% more than what would be affordable for these households (Figure 11). Another common measure of housing affordability is the ratio of an area’s median income divided by the median home sales price. This represents the number of years it would take a household earning a median wage to pay off a home in the community where they work if they put 100% of their income towards this purpose alone (Figure 12). The average hovers around 3 years, and a few reach up to 8 years. The economic impacts of the COVID-19 pandemic, such as rising unemployment, have placed further strain on those already struggling to afford their homes and introduced new uncertainties.
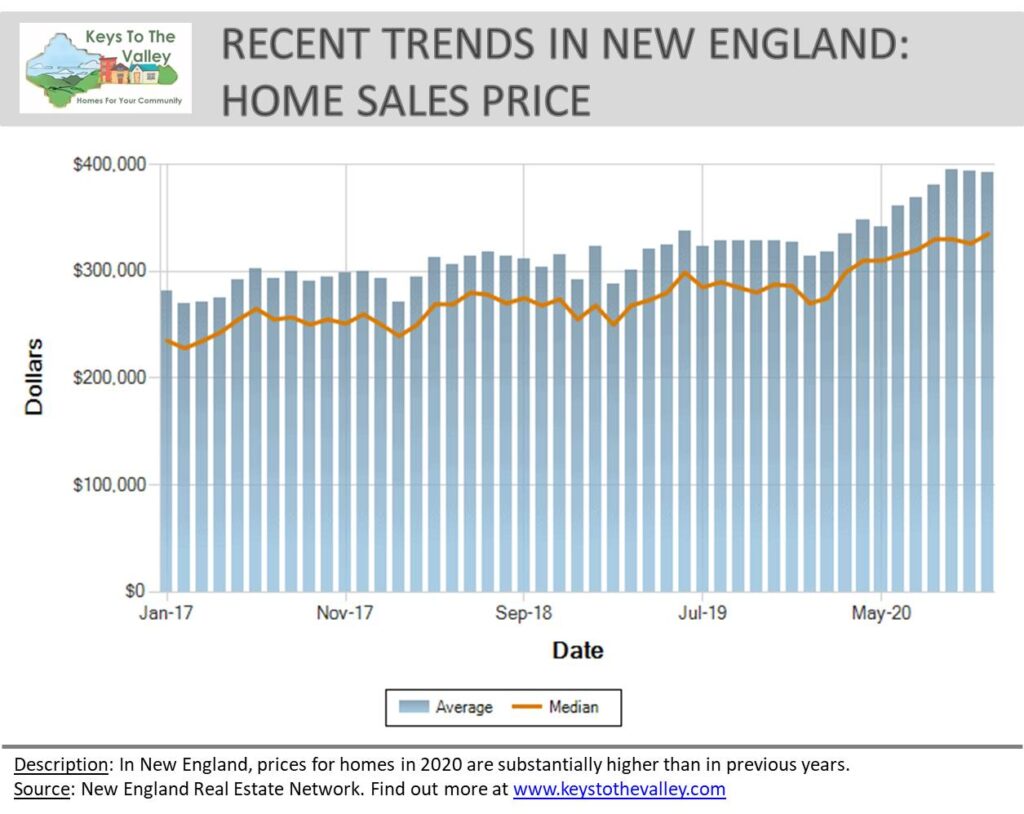
As a result of the region’s housing shortage, prices for both renters and prospective homeowners have increased in recent years and especially during the COVID-19 pandemic. Recent reports from state and real estate agencies highlight increasing challenges for both prospective homeowners and renters. In Vermont Windsor and Orange counties, current inventory of homes for sale as of September 2020 are enough for 2.6 and 2.1 months respectively, given the current sales pace. This represents a more than 65% drop in months of supply in contrast to the previous year, before the pandemic. A healthy market that equally favors buyers and sellers contains around 6 months of supply. Across New England, the median sales price increased about $100,000 in the last 3 and a half years including a continued rise during the pandemic (Figure 13). The trend of a widening gap between median home sales price and affordability for a median household income is a national one, even before the pandemic (Attainable Housing: Challenges, Perceptions, and Solutions by Urban Land Institute).